Environmental Engineering Reference
In-Depth Information
blades, but is typically in the range 1-2 Hz. For fixed-speed turbines, these variations
in mechanical input (wind speed) are directly translated into electrical output oscil-
lations, which can reach 20 per cent of the average power production. In weaker
networks, the power fluctuations can also cause voltage fluctuations, which may be
perceived as light flicker. This is much less of a problem for variable-speed
machines, since short-term variations in wind speed (gusting) can be buffered as
changes in rotor speed through the rotating blade inertia. Short-term variations in
wind speed will also introduce oscillations in power output, arising from the limited
bandwidth of the pitch-regulation mechanism (Larsson, 2002).
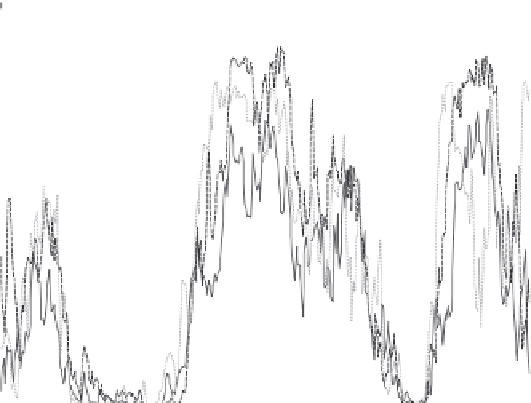
Now looking over the period of one week in June 2004, Figure 5.12 illustrates
the variation in output of three neighbouring wind farms. Periods can be seen of
almost zero output, over 100 per cent rated output, and often rapid excursions
between the two extremes. Although each characteristic is distinct, there is clearly a
similarity in the observed power output from the three wind farms.
An understanding of the variability of production over this period can be
gleaned from European weather maps for the period 22-25 June 2004 (Figure 5.13).
A low pressure cyclone, beginning in Sole/Fitzroy, can be seen moving in a north-
easterly direction towards Ireland on 22/23 June, before heading towards Scotland
and Scandinavia on 24/25 June. Within the cyclone, the wind blows in a counter-
clockwise direction around a region of low pressure, with stronger winds close to
the centre, except for the central region itself where wind strength generally falls
off. Figure 5.12 (wind farm production), taken with Figure 5.13 (weather map) on
the morning of 22 June, shows low wind power output before the pressure system
arrives. Over the next 24 hours, production increases, as the outer regions of the
120
100
80
60
40
20
0
20 Jun
21 Jun
22 Jun
23 Jun
24 Jun
25 Jun
26 Jun
27 Jun
Time (day)
Figure 5.12
Single wind farm variability - one week (three wind farms)


Search WWH ::

Custom Search