Graphics Programs Reference
In-Depth Information
1.
In Photoshop, choose File > Save As. Name the file
Model_final.psd
, and
click Save. Click OK if you see the Photoshop Format Options dialog
box.
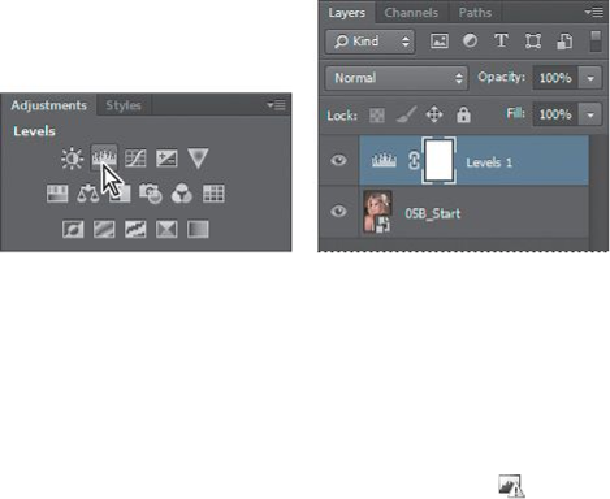
2.
Click the Levels button in the Adjustments panel.
Photoshop adds a Levels adjustment layer to the Layers panel. The Levels controls
and a histogram appear in the Properties panel. The histogram displays the range
of dark and light values in the image. The left (black) triangle represents the shad-
ows; the right (white) triangle represents the highlights; and the middle (gray) tri-
angle represents the midtones, or gamma. Unless you're aiming for a special ef-
fect, the ideal histogram has its black point at the beginning of the data and its
white point at the end of the data, and the middle portion has fairly uniform peaks
and valleys, representing adequate pixel data in the midtones.
3.
Click the Calculate A More Accurate Histogram button (
) on the left
side of the histogram. Photoshop replaces the histogram.