Biology Reference
In-Depth Information
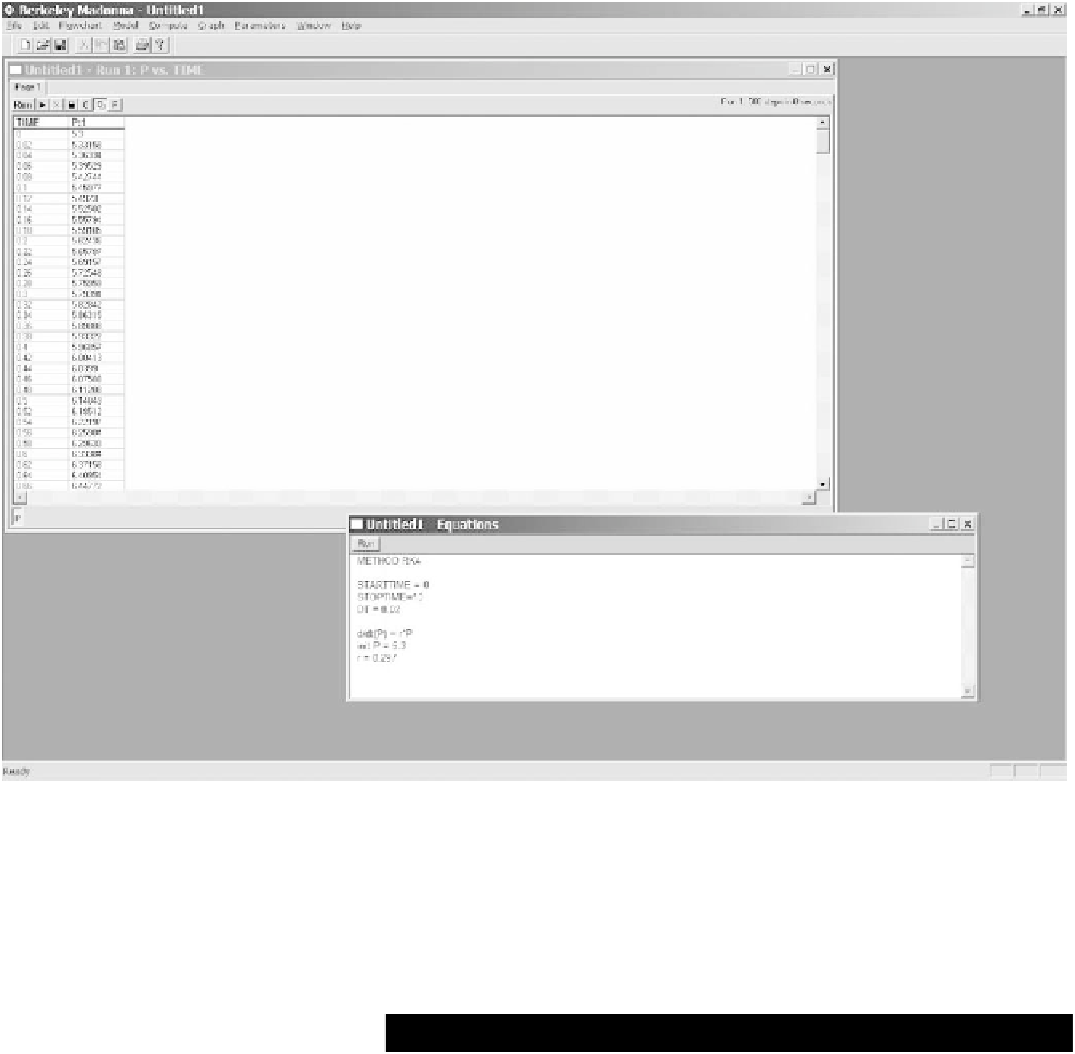
FIGURE 1-27.
BERKELEY MADONNA numerical solution as a table of values.
Time t
Biomass P(t)
Time t
Biomass P(t)
Time t
Biomass P(t)
0
9.6
7
257.3
14
640.8
1
18.3
8
350.7
15
651.1
2
29
9
441
16
655.9
3
47.2
10
513.3
17
659.6
4
71.1
11
559.7
18
661.8
5
119.1
12
594.8
—
—
6
174.6
13
629.4
—
—
TABLE 1-8.
Yeast culture growth data. (Data taken from Carlson [1913] and Pearl [1927].)