Biology Reference
In-Depth Information
DLBCL
Germinalcentre B
Nl, lymph node/tonsil
Activated blood B
Resting/activated T
Transformed cell lines
FL
Resting blood B
CLL
A
G
Pan B cell
Germinal Centre
B cell
T cell
Activated B cell
Proliferation
Lymph node
−
2
−
1
0
1
2
0.250
0.500
1.000
2.000
4.000
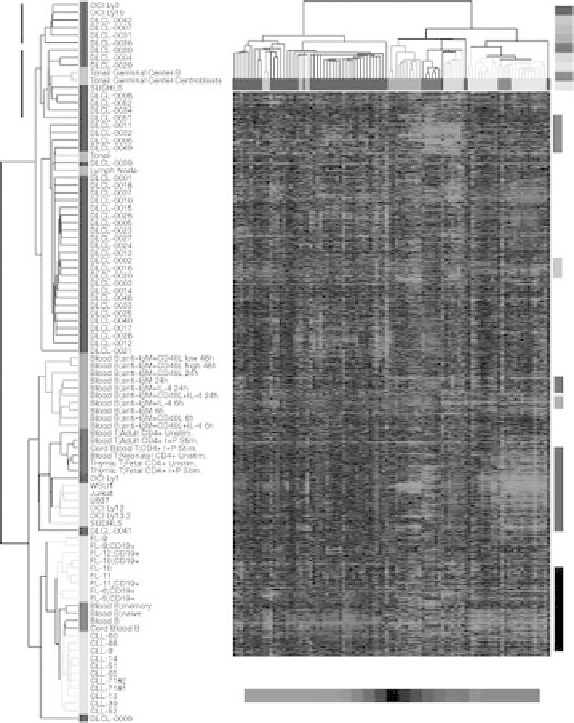
FIGURE 12-13.
A microarray graph showing the results of with row and column hierarchical clustering. The column
clustering is obtained by applying the clustering methods to the transposed data matrix X
T
.
(Figure 13 from Alizadeh et al. [2000].
2000 Macmillan Publishers Ltd. Nature, 403, 503-511.
#
Reprinted by permission.)
understanding of the interacting regulatory networks that underlie
molecular, behavioral, and physiological circadian control. Microarrays
are proving to be central to this research (see Duffield [2003]), and their
use will undoubtedly continue to be essential.
Although we are beginning to understand some of the intracellular
molecular mechanisms of circadian systems, the manner in which they
give rise to cyclic temporal patterning in behavior and physiology is still
largely unknown. A major challenge will be to experimentally unravel
the details of the mechanistic control of circadian biology, especially
with regard to environmental stimuli. By exploring circadian control and
regulation, we are also gaining a greater understanding of how
information is communicated across and between hierarchical biological
levels: molecular, cellular, tissue, organ, organ system, and whole
organism. Although it is biological questions that drive specific aims of