Biology Reference
In-Depth Information
spotted cDNAs should also be heated to denature the cDNAs and thus
render them single-stranded and available to hybridize with the labeled
cDNAs.
4
The next step in using a microarray is hybridization. In our example,
the labeled cDNAs from the normal and cancerous liver cells are
mixed together in an appropriate buffer and placed on the microarray.
The cDNAs will then bind to any features that carry complementary
DNA. Some features will bind only normal cell cDNA; some features
will bind only cancer cell DNA; some features will bind both normal and
cancer cell cDNAs; and some features will bind neither cDNA.
Following the hybridization step, the microarray is washed to remove
any unbound cDNAs. Figure 12-7(A) represents a microarray after
hybridization and washing. Note that at this point in an actual
microarray experiment, there will be no visible difference between the
hybridized microarray and a nonhybridized array. The hybridized
microarray must be scanned to determine which features have bound
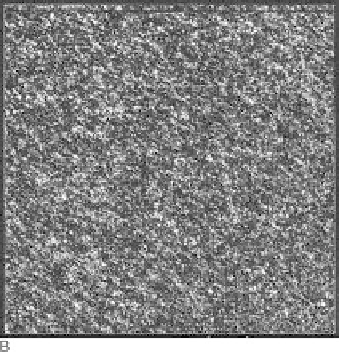
which cDNAs. Figure 12-7(B) shows an image from a scanned
GeneChip.
W
This chip has been hybridized and washed, and the light
intensity in each spot is proportional to the amount of labeled cDNA
binding at that spot.
A
The process of scanning involves the use of a light source, usually a
laser, that will excite the fluorescent label on the cDNAs. Each fluor
molecule has a characteristic excitation wavelength and a
characteristic emission wavelength. The excitation beam will excite
electrons in the fluors to a higher energy state, and then the fluors
release some of their excess energy in the form of visible light as the
electrons decay back to their original energy states. A detector is used to
measure the emitted light. The greater the amount of labeled cDNA
bound to a feature, the greater the amount of light emitted when the
microarray is scanned. The emitted light from both fluors will be
measured and recorded as image files. Laser scanning confocal
microscopy can be used for this process, and a number of different types
of scanners are commercially available.
FIGURE 12-7.
Panel A: Graphic representation of microarray
following hybridization and washing. Each circle
represents a gene. The circles filled with vertical
lines represent hybridization with the cDNA from
one cell type; those filled with horizontal lines
represent hybridization with the cDNA from the
other cell type; and those filled with grids
represent hybridization with cDNA from both
cell types. Empty circles represent features which
did not hybridize with either cDNA; panel B:
Actual output from an Affymetrix GeneChip
W
.
Data from an experiment showing the expression
of thousands of genes on a single GeneChip
W
.
(Image courtesy of Affymetrix, Inc).
II. ANALYSIS OF MICROARRAY DATA
A. Filtering and Normalization
Once the image files are acquired, the images are converted into
quantitative data measuring the intensity of fluorescence at each spot.
The first step is to determine where the spots are, how much of the
fluorescence at each spot is caused by the hybridization, and how much
may be caused by nonspecific background fluorescence. Determining
4. Oligonucleotides are already single-stranded and do not need to be denatured.