Biology Reference
In-Depth Information
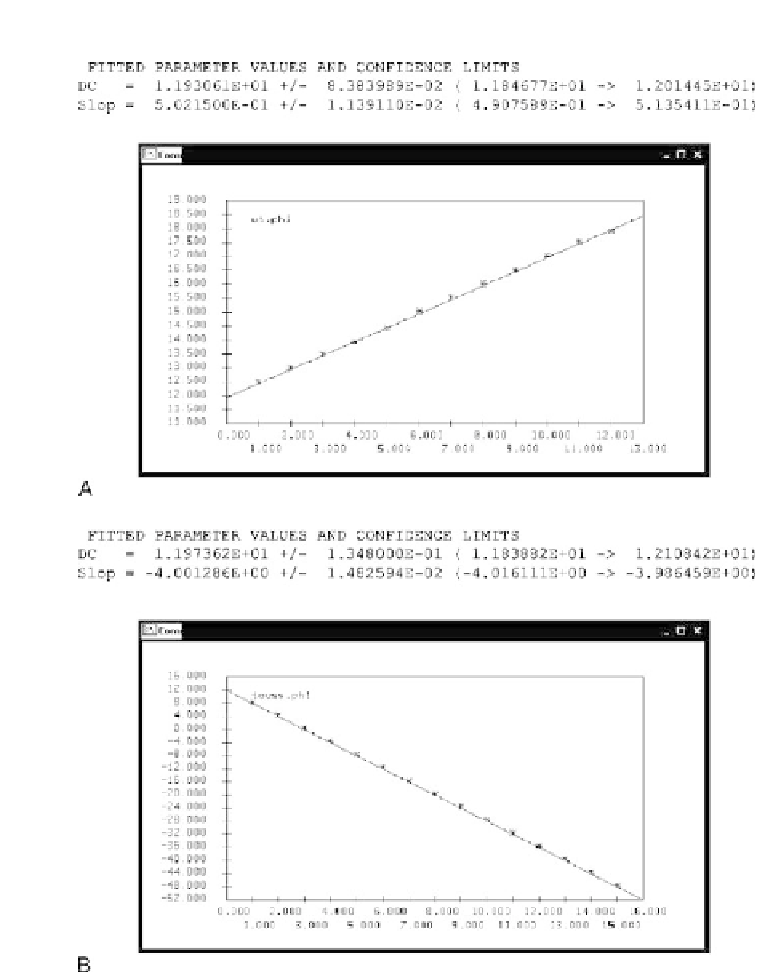
FIGURE 11-37.
Plots of the daily times of maximum obtained by using PHASEREF. The phase shifts are evident from
the nonzero slopes of the fitted least-squares regression lines.
(
Continued
)
amplitudes. From the data in Figures 11-35 and 11-38, we can
estimate this ratio to be approximately from 3:1 to 5.5:1. Further
analyses will be necessary in order to obtain a more accurate
estimate (the known relative contributions in this simulated example
are 75% 20-hour rhythm and 25% 24.5-hour rhythm). Outputs from
such additional procedures using the data from this example can
be downloaded from our Web site. We encourage the reader to consider
them and continue the exploration.