Biology Reference
In-Depth Information
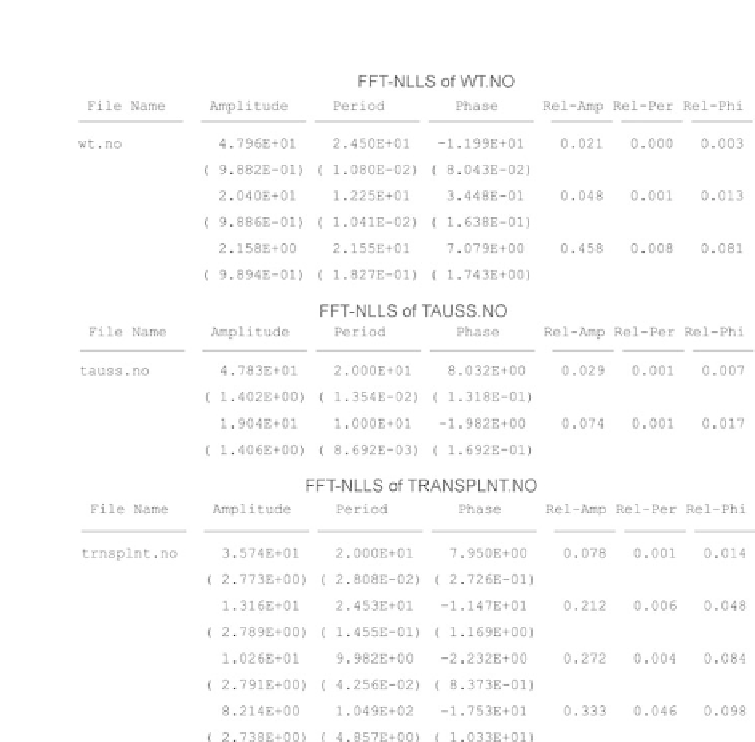
FIGURE 11-35.
FFT-NLLS analysis of the original data.
phase shifts for the rhythm are estimated as part of the output in
Figure 11-35.
The decreasing patterns in acrophase times for the transplant data
also indicate a shorter than 24-hour period, but the linear model may
not be the best fit, because there appears to be a pattern to the
residuals. This may be indicative of a more complex rhythmic
component structure, composed of at least two periodic components.
Thus, additional analyses are needed in order to determine the
composition of the rhythm. In Figure 11-38, we present the output
from the FFT-NLLS procedure on the detrended transplant data,
as well as on the ARFILTERed original data TRNSPLNT.NO.
The detrended data are of particular interest, because the large
estimated period of 104.9 hours in Figure 11-35 may be related to
an attempt to fit for the trend. Observe that the large period
estimate is no longer present for the detrended data (top panel of