Biology Reference
In-Depth Information
2
2
p
1.5
1
0.5
0
−
0.5
−
1
−
1.5
−
2
−
2
0
2
4
6
8
10
Time
p
7
p
−
A
4
4
2
p
1.5
1
0.5
0
−
0.5
−
1
−
1.5
−
2
−
2
0
2
4
6
8
10
p
7
p
Time
−
B
8
8
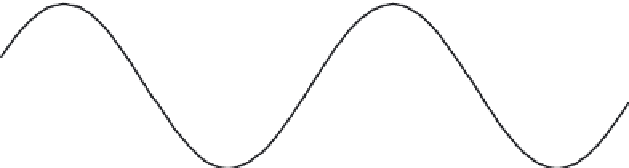
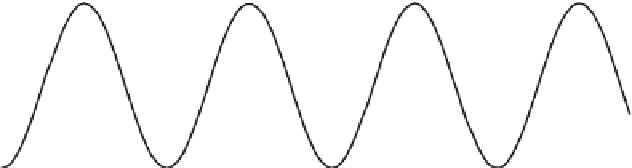
FIGURE 11-11.
Graphs of cos(t þ p/4) (panel A) and cos(2t þ p/4) ¼ cos(2(t þ p/8)) (panel B).
One way to identify whether the period changes and how it changes is by
the phase shift. This is particularly useful when an estimate is available for
the length of the cycle, such as 24 hours for circadian rhythms. Consider
the graph shown in Figure 11-13(A), which is periodic with an exact period
of 24 hours. In Figure 11-13(B), we have plotted the phase shift for each
cycle. In the context of circadian rhythms, this can be interpreted as the
time of day at which the maximum value (also called acrophase) occurs.
If there is no change in the period, the maximum value will always occur
at the same time every day, and the plot will be composed of values
arranged in a horizontal line [see Figure 11-13(B)]. Now consider the graph
in Figure 11-13(C), where the phase is shifting by a constant amount when
considered relative to a 24-hour period. Figure 11-13(D) shows the time
at which the maximal value occurs for each day. As the line has positive
slope, this means that the maximal value occurs later and later each day.