Biology Reference
In-Depth Information
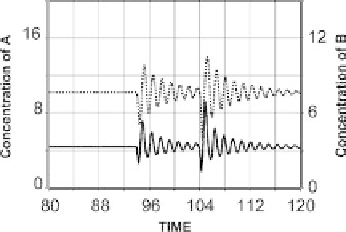
(the second perturbation was sevenfold higher). The simulation was
performed by decreasing the secretion rate of B (parameter b, which in
this case is equal to 40) 3- and 21-fold, lasting 1/3 time units. Inhibition
of B removes the trajectory in the phase space away from the fixed point
in a dose-dependent manner, and the system gets enough energy to
initiate a waning sequence of pulses, as shown in Figure 10-21. The
frequency of the pulses is controlled by the coefficients of the core
system Eq. (10-22), while the initial peak amplitude depends on the level
of the perturbation.
FIGURE 10-21.
Oscillations generated by perturbation of the
system in Eq. (10-22). The plot depicts a brief (1/3
time units) suppression of the secretion of B (black
line) at t ¼ 94 and t ¼ 104. The second
perturbation was sevenfold higher.
In the above example, the perturbations were independent of the core
system. In Section V, we show that delayed system feedback could evoke
a similar effect, providing enough energy and generating oscillations in
submodels with damped periodicity.
E. Identifying Nodes, Controlling the Oscillations
All of the system models considered so far were based on prior
knowledge of the interaction between hormones, which was then
utilized to create schematic diagrams describing the specific links of
interaction (see, for example, Figures 10-5 and 10-14). We now examine
possible approaches that would allow us to decide whether such
interactions exist between hormones. We suggest experimental
paradigms tailored to support or reject the hypothesis that two
hormones, A and B, are interconnected in a specific oscillating
networklike construct (like those in Figure 10-14).
We begin by describing a commonly encountered situation in which
the results of mathematical simulations could provide valuable
information for further experimental investigations. Consider, for
example, a system in which B is the major oscillating hormone, its
concentration in the bloodstream is readily assessable, and experimental
data indicate that its release is controlled by another hormone, A. As
frequently occurs, however, measuring hormone A directly may be
experimentally difficult. For example, some human neuroregulators/
hormones, such as GHRH or gonadotropin-releasing hormone, are
produced in the hypothalamus and control major pituitary peptides
(such as GH and LH). Unfortunately, direct measurement of these
hormones in the bloodstream is difficult, because they are secreted in
small quantities and their concentration in the circulation is practically
undetectable. When the concentration of A cannot be measured directly,
the question of whether a delayed feedback loop between A and B exists to
drive the oscillations of B cannot be answered directly, either. However,
we can use mathematical models to facilitate the design of specific
experiments exploring system connectivity. In this situation, the results
of the real experiments are interpreted based on the outcome of the
simulated experiments.