Biology Reference
In-Depth Information
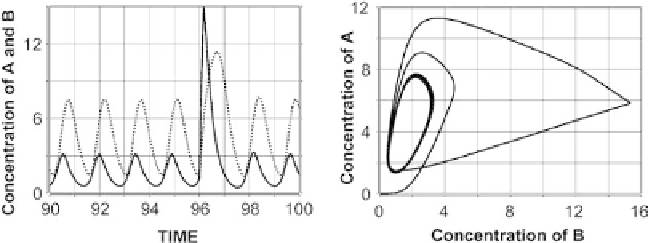
respond to a fourfold decrease in feedback latency? That is, how will the
model be affected by decreasing the delay time from D
¼
1toD
¼
0.25?
To gain a better insight into this question, note that according to (a)
above and Figure 10-16 (left panel), the peak response of B to
endogenous A-drive is almost maximal. Therefore, an exogenous bolus
of the stimulator A cannot bring forth dose-dependent release of B-
secretion at levels notably higher than the typical endogenous B-
concentration. This may be because the delay in the feedback is
sufficiently long to provide enough time for the pulses to unfold. This is
confirmed by the result produced by the model after 4-fold decrease in
feedback latency. The output, presented in Figure 10-17, displays
decreased peak amplitudes and elevated nadirs. The typical
(endogenous) peak heights are lower than expected [(a) and (b) above],
but the system is capable of responding to exogenous stimulation with
higher pulses (Figure 10-17). Also, there is an increase in pulse frequency
caused by the shorter feedback delay.
To provide an example that approximates the network where A inhibits
the secretion of B (Figure 10-14, right panel), we use the following
reference system of delayed ODEs:
3
dC
A
dt
¼
½
C
B
ð
t
1
Þ=
2
3C
A
ð
t
Þþ
20
3
½
C
B
ð
t
1
Þ=
2
þ
1
(10-16)
dC
B
dt
¼
1
ð
Þþ
1
:
3C
B
t
40
3
½
C
A
ð
t
Þ=
2
þ
Note the difference from Eq. (10-15): the up- (down)-regulatory
function is replaced by a down- (up)-regulatory function. This system
also has a stable periodic solution, a graph of which is presented in
Figure 10-18:
We need to outline the framework that links the system parameters
with experimental observations. This information is important
FIGURE 10-17.
Left panel: The effect of fourfold decrease in feedback latency [all other model parameters are the
same as in Eq. (10-15)]. The black line illustrates the evolution of the stimulator A; the dotted line
depicts hormone B. The plot also shows the model response to a brief bolus of hormone A
introduced at t ¼ 96:00. Right panel: Corresponding phase diagram.