Biology Reference
In-Depth Information
binding affinity of hemoglobin for oxygen molecules. Both functions are
monotone and map the interval [0,
1
] to [0,1].
The parameter T
0 in the definition of the functions (10-5) is called a
threshold, and the power n
>
>
0 is called a Hill coefficient. The threshold
T in an up-regulatory Hill function is sometimes denoted by ED
50
and is called median effective dose. Analogously, in a down-regulatory
control function is referred to as ID
50
,ormedian inhibitory dose (see
Exercise 10-5). The parameters ED
50
and ID
50
approximate the potency
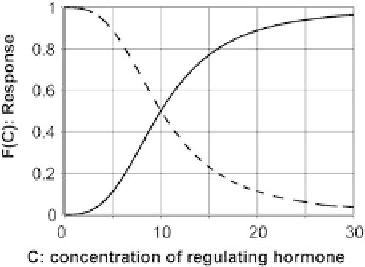
of the regulatory hormone. The parameter n controls the slope of the Hill
functions. For a fixed value of T, the larger the value of n, the
steeper the slope. The Hill functions F
up
and F
down
are displayed in
Figure 10-11 for n
1 (the so-called
Michaelis-Menten equation), the function has no inflection points, and
its profile is a branch of a hyperbola.
¼
3 and T
¼
10. When n
¼
FIGURE 10-11.
Exemplary profiles of up-regulatory (black line) and
down-regulatory (dotted line) Hill functions. In both
examples and n
¼
3 and T
¼
10.
E
XERCISE
10-5
Show that F
up
¼
1
F
down
;
F
up
ð
T
Þ¼
1
=
2
;
and F
down
ð
T
Þ¼
1
=
2
:
When Hill functions such as in Eqs. (10-5) are used, the mathematical
form of the system component of the control function S
A
from
Eq. (10-4) can be defined as:
S
A
;
system
ð
C
B
Þ¼
aF
up
;ð
down
Þ
ð
C
B
Þ:
(10-6)
The parameter a represents the efficacy of hormone B, the maximal effect
B can produce on the secretion of A. With this choice of S
A
;
system
, the
control function S
A
from Eq. (10-4) takes the form
S
A
¼
S
A
;
basal
þ
aF
up
;ð
down
Þ
ð
C
B
Þ:
(10-7)
Figure 10-12 summarizes several examples, illustrating the changes
in the control function in response to changes in the model
parameters T, n, and a. We use the up-regulatory control function
n
3
ð
C
=
T
Þ
ð
C
=
10
Þ
S
ð
C
Þ¼
a
¼
20
3
as a reference (the described
n
1
þð
C
=
T
Þ
1
þð
C
=
10
Þ
changes refer to the following initial values of the parameters: T
¼
10,
n
¼
3, and a
¼
20).
Figure 10-12 (left panel) represents changes in the response curve caused
by varying the potency and/or efficacy (represented by the parameters
T and a, respectively). Increasing T leads to decreasing the potency of the
regulating hormone, because this means that higher concentrations of
the regulatory hormone are necessary for reaching the median effective
dose. In contrast, decreasing T would lead to increasing the potency of
the regulating hormone (not shown). Changes in the value of the efficacy