Biology Reference
In-Depth Information
growth of A. In addition, there is the presence of explicit delay for the
stimulatory action of A upon B. This system contains one feedback, in
which any one of the variables feeds back to suppress its own growth,
and this feedback action is mediated by the other variable.
Example 10-1
.........................
Delayed Population Growth. Recall from Chapter 1 the classical logistic
growth equation
P
dP
dt
¼
P
ð
t
Þ
r 1
ð
t
Þ;
K
where K
0 is the inherent
per capita growth rate for the population, and P(t) is the size of the
population at time t. It presents a model in which population size is
limited by available resources. However, as we discussed, a limitation of
this model is that it fails to take into consideration the time necessary
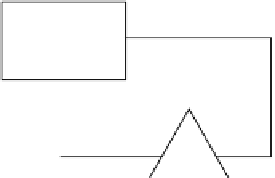
for complex organisms to reach reproductive age. Thus, the diagram in
Figure 10-3 illustrates a self-inhibitory effect (autofeedback) for the
population size delayed by the delay time D necessary for each
individual to reach reproductive age.
>
0 is the carrying capacity of the system, r
>
Notice that the origin of the line indicating excitatory input for the
population size P(t) is not shown. The input here is generated by the
flow of natural resources that support the living organisms in the
system. It also depends on the size of the population, and, de facto,
P stimulates its own growth, providing an example of a self-stimulatory
feedback mechanism that would force the system to explode if not
restricted by the (negative) feedback. A differential equation
corresponding to the diagram in Figure 10-3 is the classical delayed
logistic growth equation:
(
+
)
P
(
−
)
D
P
FIGURE 10-3.
Schematic representation of autofeedback with delay.
dP
dt
¼
P
ð
t
D
Þ
r 1
ð
t
Þ:
K
Example 10-2
.........................
(
+
)
A Predator-Prey Model. The diagram in Figure 10-4 schematically
represents the Lotka-Volterra predator-prey model. Because the owls
feed on the voles, the growth of the vole population causes growth in the
owl population (excitatory input). Because the growth of the
owl population causes the vole population to decline in size
(inhibitory input), there is a negative feedback between the owls and the
voles (see Chapter 2 for details).
OWLS
VOLES
(
−
)
FIGURE 10-4.
Schematic presentation of the feedbacks in Lotka-
Volerra's predator-prey model.


