Biology Reference
In-Depth Information
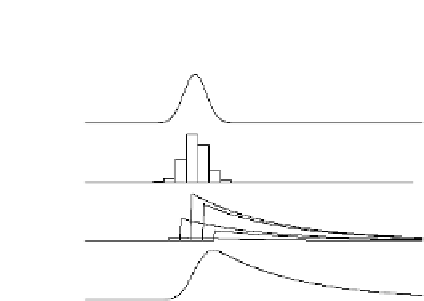
Secretion
secretion into the serum as a function of time). The second panel
approximates this secretion event with a series of rectangles. The third
panel shows an elimination function for each of the rectangles in the
panel above. For each rectangle of secretion, the concentration increases
and subsequently decays according to the elimination function. The
bottom panel of Figure 9-19 is the resulting total concentration as a
function of time. It is the sum of all of the elimination time courses for
the individual secretion rectangles. This panel shows the rapid increase
in concentration followed by the slow decay typical of hormone
concentration time-series data.
Approximation
Individual Eliminations
Concentration
Time
FIGURE 9-19.
A graphical depiction of the coupling between
secretion and elimination. (Figure 31.2 from
Johnson, M.L., Straume, M. [1999]. Innovative
quantitative neuroendocrine techniques. In Sex-
steroid interactions with growth hormone
[Serona Symposia]. pp. 318-326. New York:
Springer-Verlag.
#
1999 Springer-Verlag. With
kind permission of Springer Science and
Business Media. Reproduced with permission
from BioSymposia, Inc. [formerly Serono
Symposia USA].)
In Chapter 1, we assumed that drug elimination from the blood occurs at
a rate proportional to the amount of the drug. This led to an exponential
law for the decrease in the concentration (i.e., under this assumption
E(t)
e
kt
, where k
ln(2)/HL and HL is the elimination half-life).
The pharmacokinetic elimination of substances, including hormones,
from the blood is a well-studied aspect of medical pharmacology.
Because there are different factors contributing to the elimination of
substances (each doing so in an exponential fashion), the most general
form of the elimination function is given by the sum of exponential
decays. The actual number of decays being summed can be large,
because most substances are eliminated via multiple biochemical
pathways. However, in the majority of cases, a single exponential decay
is sufficient to describe the experimental data, and only in very rare
cases are more than two exponential decays required.
¼
¼
The mathematical forms for the one- and two-exponential elimination
functions are given in Eqs. (9-10) and (9-11), respectively. In Eq. (9-11),
f
2
(0 <f
2
< 1) represents the fractional amplitude of the second
elimination term, whereas HL
1
and HL
2
are the first and second
elimination half-lives. These two equations are equal to zero when
t<0 so that the elimination does not occur before the secretion. A typical
plot of these elimination functions is shown in the third panel in
Figure 9-19.
HL
t
;
(
e
kt
ln2
e
E
ð
t
Þ¼
¼
when t
0
(9-10)
0
;
when t<0
HL
1
t
HL
2
t
(
ln2
ln2
e
f
2
e
e
k
1
t
f
2
e
k
2
t
E
ð
t
Þ¼
ð
1
f
2
Þ
þ
¼ð
1
f
2
Þ
þ
;
when t
0
:
0
;
when t<0
(9-11)
The stepwise rectangular approximation of the secretion rate may
appear too inaccurate, but it can be improved by increasing the number
of steps using more, narrower rectangles. For example, if one thinks of
the amount of hormone being secreted in a small interval of time
D
t after