Biology Reference
In-Depth Information
6
5
4
3
2
1
100
92
84
76
200
400
600
800
Minutes
1000 1200 1400
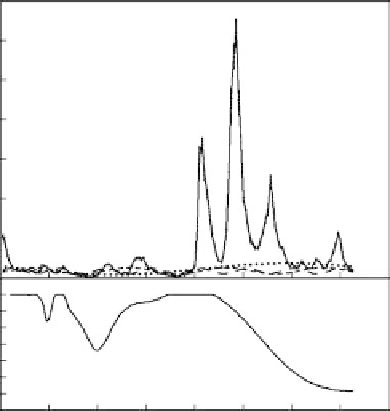
FIGURE 9-15.
The lower panel in Figure 9-13 plots the percent remaining variance, as a function of the period L,
after the GH example has been fit to a Fourier component as in Eq. (9-6). The upper panel of
Figure 9-13 presents the growth hormone data from Figure 9-6 and the weighted least-squares
estimated Fourier components corresponding to periods of 1440 minutes (dotted line), 398 minutes
(short dashed line), and 193 minutes (long dashed line).
75
14
50
12
25
10
12
8
10
6
8
6
4
4
200
600
1000
1400
100
200 300
Minutes
400
Minutes
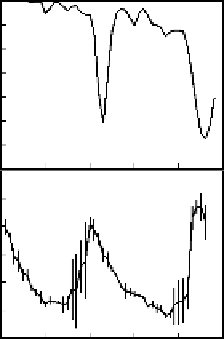
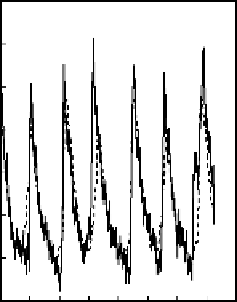
FIGURE 9-16.
Results from the periodic signal averaging method applied to the LH data in Figure 9-5.
the data is 460 minutes. With one data point sampled every 10 minutes,
460 minutes corresponds to 46 data points. The lower right panel
presents a signal-averaged waveform that assumes a period of 46 data
points. The first (from the left) point in the lower right panel is the
average of the 1st, 47th, 93rd, and 139th data points. The second point in