Biology Reference
In-Depth Information
1.0
D
.8
.6
Y
T
.4
.2
.0
.0
.4
.8
1.2
1.6
2.0
2.4
2.8
[O
2
]
×
10
5
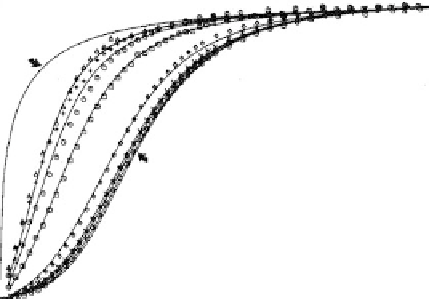
FIGURE 7-4.
Oxygenation curves determined at a series of hemoglobin concentrations. Each symbol represents
experimental data from an oxygenation curve measured at a given hemoglobin concentration.
The solid lines are calculated curves based on the oxygenation linked dimer-tetramer association
scheme. The hemoglobin monomer concentration ranges from 4
10
8
M for the data on the left,
10
4
M for the data on the right.
(Reprinted with permission from Mills, F.C., Johnson, M.L., and Ackers, G.K. [1976]. Oxygenation-
linked subunit interactions in human hemoglobin: Experimental studies on the concentration
dependence of oxygenation curves. Biochemistry, 15, 5350-5362.
to 4
1976 The American Chemical
#
Society.)
hemoglobin (see Figure 7-4). This observation cannot be explained by
either the Hill or the Adair equations, but only by a mechanism whereby
the hemoglobin is involved in a reaction dependent upon the
hemoglobin concentration, because hemoglobin is not always a tetramer,
even at the high concentrations found within red blood cells. The
tetramer structure of hemoglobin, determined by Perutz using
radiograph crystallography, describes only hemoglobin molecules in
crystal form. In solution (e.g., in the blood), its degree of subunit
assembly varies based on the hemoglobin concentration. But if under
such conditions hemoglobin is not a tetramer, then what is it?
It is now known that hemoglobin may also exist as dimers, each
consisting of one alpha chain and one beta chain. The alpha and beta
chains have different amino acid sequences, but similar three-
dimensional structures. Each contains a heme group, and each can bind
to O
2
. The binding of O
2
to dimers is not cooperative, whereas
the binding to tetramers is. As the binding affinity of tetramers is
different from that of dimers, the oxygenation curves depend on the
ratio between dimers and tetramers. This ratio, in turn, depends on the
hemoglobin concentration and the oxygen concentration.
Figure 7-4 presents experimental and calculated fractional-binding
oxygenation curves, determined at a series of human hemoglobin
concentrations, and contains examples of both noncooperative and
positive cooperative binding curves. Curve D is an example of the
nonsigmoid shape of a noncooperative curve, as in myoglobin and