Biology Reference
In-Depth Information
18,000
10,000
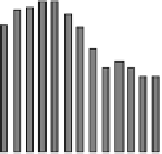
Sample Asymmetry = 1.37
R1 = 42
R2 = 57.5
16,000
1,000
12,000
100
8000
10
4000
0
1
A
median
18,000
10,000
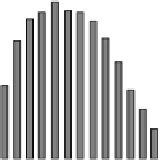
Sample Asymmetry = 2.97
R1 = 27
R2 = 79.5
16,000
1,000
12,000
100
8000
10
4000
1
0
B
18,000
10,000
median
16,000
Sample Asymmetry = 11.8
R1 = 45.5
R2 = 538.5
1,000
12,000
100
8000
10
4000
0
1
−
20
0
20
40
60
80
100
120
C
Difference from median [msec]
FIGURE 6-8.
Plot of RRI distribution. The three panels are from the same infant while clinically stable (panel A)
and from 18 (panel B) and 9 (panel C) hours before an acute clinical deterioration leading to death.
(From Kovatchev, B. P., Farhy, L. S., Hanging, C., Griffin, M. P., Lake, D. E., Moorman, J. R. [2003].
Sample asymmetry analysis of heart rate characteristics with application to neonatal sepsis
and systemic inflammatory response syndrome. Pediatric Research, 54, 892-898. Used by
permission.)
The data depicted in Figure 6-8 suggest that the SA may hold promise as
a marker quantifying HRV related to upcoming sepsis and SIRS
episodes. In the last example, the SA was markedly higher 18 hours
before the emergence of clear clinical symptoms. It could be
hypothesized that if treatment had been initiated at this time, there
would have been a possibility of saving this infant's life.
The SA has performed well in one example. Does this mean that it will
perform the same way for another individual data set, for a group of
data sets, or for all data sets? The appropriate way to answer such