Biology Reference
In-Depth Information
1400
SA
= 1.1
1200
1000
800
600
400
200
Median
m
0
225
250
275
300
325
350
375
400
425
450
A
RR interval [msec]
1400
SA
= 3.5
1200
1000
800
600
400
Median
m
200
0
200
225
250
275
300
325
350
375
400
425
450
B
RR interval [msec]
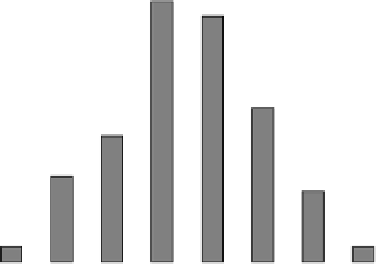
FIGURE 6-7.
SA for an approximately symmetric versus nonsymmetric distribution of RRIs.
condition of the baby, as described earlier. A better description of the
observed phenomenon is offered by considering the SA of the three
data sets.
In Figure 6-8, the value of the SA for the data in panel A is 1.37, showing
approximately symmetric distribution of the RRIs in a condition of
health. In panel B, the value of SA increases to 2.97, and the value of the
left weighting R
1
decreases to 27, pointing to certain abnormalities
(reduced accelerations and increased decelerations) beginning to appear
in this infant's HR 18 hours before any clinical signs of sepsis. Nine
hours before the onset of sepsis (panel C), the value of the SA has
increased dramatically to 11.8, mainly because of a large number of
substantial heart decelerations. This is confirmed by the 10-fold increase
in the value of R
2
over its healthy baseline.