Biology Reference
In-Depth Information
a smaller SD. If a sample of RRIs has predominantly decelerations, and
few accelerations, their histogram would have a longer right tail and
almost no bars to the left of its mode (thus, its shape will be similar to
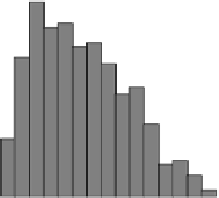
that in panel B). Conversely, if the sample of RRIs includes mostly
accelerations, but no decelerations, the histogram would be similar in
shape to that in panel C—with a long left tail and almost no bars to the
right of its mode.
0.20
0.18
0.16
0.14
0.12
0.10
0.08
0.06
0.04
0.02
A
0.00
However, the SD and the skewness of the distribution of RRIs have
certain limitations. In particular, SD and skewness are computed with
respect to the mean of the distribution, which is quite vulnerable to large
deviations and does not accurately represent the center of a skewed
distribution. Figure 6-6 exemplifies this point by presenting
a sample of RRIs that includes transient decelerations. These
decelerations result in an asymmetric distribution, with a longer right
tail. As a result, the mean and the median of that sample do not
coincide—the mean is influenced by a few decelerations and is
substantially shifted to the right, poorly describing the center of the
RRI distribution. This and other limitations make SD and skewness
insufficiently accurate for the life-saving task of predicting sepsis in
prematurely born infants.
0
1
2
3
4
5
6
7
8
9
10 11 12 13 14 15 16 17 18 19 20
0.20
0.18
0.16
0.14
0.12
0.10
0.08
0.06
0.04
0.02
B
0.00
0
1
2
3
4
5
6
7
8
9
10 11 12
13 14 15 16 17 18 19 20
0.20
0.18
0.16
0.14
In order to overcome this limitation, we need to compute measures that
quantify deviations in the length of RRIs from their median. In addition,
such measures (unlike SD or skewness) will need to allow for a separate
quantification of HR accelerations (deviations less than the central RRI,
forming the left-hand portion of the histogram) and decelerations
(deviations greater than the central RRI, forming the right). The next
0.12
0.10
0.08
0.06
0.04
0.02
C
0.00
1
2
3
4
5
6
7
8
9
10 11 12 13 14 15 16 17 18 19 20
FIGURE 6-5.
Typical histogram of a symmetric (panel A),
skewed to the right (panel B), and skewed to the
left (panel C) statistical distributions.
1400
1200
1000
800
600
400
200
Median
Mean
0
200
225
250
275
300
325
350
375
400
425
450
RR interval [msec]
FIGURE 6-6.
Sample of RRIs that includes transient decelerations. Note the skewness of the distribution.