Biology Reference
In-Depth Information
100
80
Low BG Risk
High BG Risk
60
40
Target Range
20
0
0 2 4 6 8 1012141618 2022 242628303234
BG Level (mmol/L)
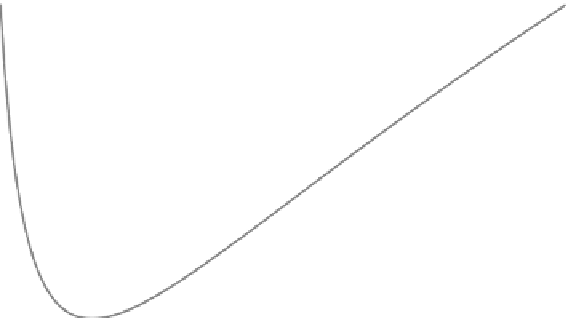
FIGURE 5-9.
The BG risk function in the original scale. Note the asymmetrical nature of the function. (From
Kovatchev, B. P., Straume, M., Cox, D. J., & Farhi, L. S. [2001]. Risk analysis of blood glucose data:
A quantitative approach to optimizing the control of insulin dependent diabetes. Journal of Theoretical
Medicine, 3, 1-10. Used by permission of Taylor & Francis, Ltd. [
http://www.informaworld.com]).
Based on the BG risk function, we are now ready to develop two new
SMBG characteristics:
The LBGI—a measure of the frequency and extent of low BG read-
ings, and
The high BG index (HBGI)—a measure of the frequency and extent
of high BG readings.
VII. THE LOWAND HIGH BLOOD GLUCOSE
RISK INDICES
We want to assess the risk caused by low readings and high readings
separately. To do this, we separate the low scores [those for which
f (BG) < 0] from the high scores [those for which f (BG)
>
0]. We begin
with an example and then show the general formula.
Example 5-1
.......................
Suppose the f (BG) readings for a patient are
1, 2, 0.4, 1, and 2.5. Then
the low readings are
1 and
0.4, and the risk function values are:
2
2
2
2
10
½
f
ð
BG
Þ
¼
10
ð
1
Þ
¼
10 and 10
½
f
ð
BG
Þ
¼
10
ð
0
:
4
Þ
¼
1
:
6
:
We now sum these values and divide by 5 (the total number of
readings). This gives: