Biology Reference
In-Depth Information
0.40
0.35
0.35
0.30
0.30
0.25
0.25
0.20
0.20
0.15
0.15
0.10
0.10
0.05
0.05
0.00
A
0.00
B
0
1
2
3
4
5
6
7
8
0
1
2
3
4
5
6
7
8
0.25
0.25
0.20
0.20
0.15
0.15
0.10
0.10
0.05
0.05
0.00
C
0.00
01234567891011121314151617181920
01234567891011121314151617181920
D
0.16
0.14
0.14
0.12
0.12
0.10
0.10
0.08
0.08
0.06
0.06
0.04
0.04
0.02
0.02
0.00
E
0.00
F
0
5
10
15
20
25
30
35
40
45
50
0
5
10
15
20
25
30
35
40
45
50
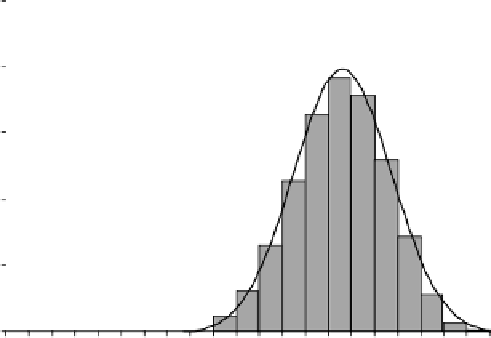
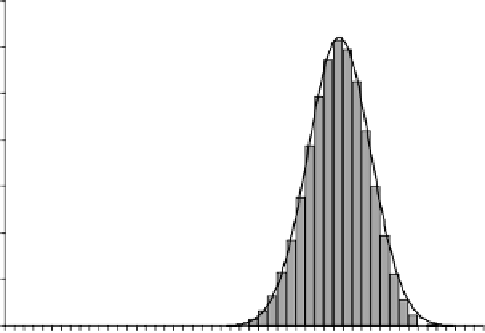
FIGURE 3-10.
The distribution of colors in F
2
for a different number of controlling genes m with probabilities p and 1
, respectively. While
for p ¼ 1/2 the histogram is symmetric, for p 6¼ 1/2 this is not the case. However, as the diagrams in Figure 3-10 exemplify, even for values p 6¼ 1/2,
the distribution becomes quite symmetric when m is relatively large. Panel A: m ¼ 4, p ¼ 0.2; panel B: m ¼ 8, p ¼ 0.7; panel C: m ¼ 10, p ¼ 0.2; panel D:
m ¼ 10, p ¼ 0.7; panel E: m ¼ 25, p ¼ 0.2; panel F: m ¼ 25, p ¼ 0.7.
p for the alleles
R
and
r