Biology Reference
In-Depth Information
K
1
=13.0
14
13
13.0
y
=
12
1+e
3.32816
−
0.21827x
Saccharomyces
11
10
9
8
7
6
5
4
Saccharomyces in mixed population
3
2
1
0
10
20
30
40
50
60
Hours
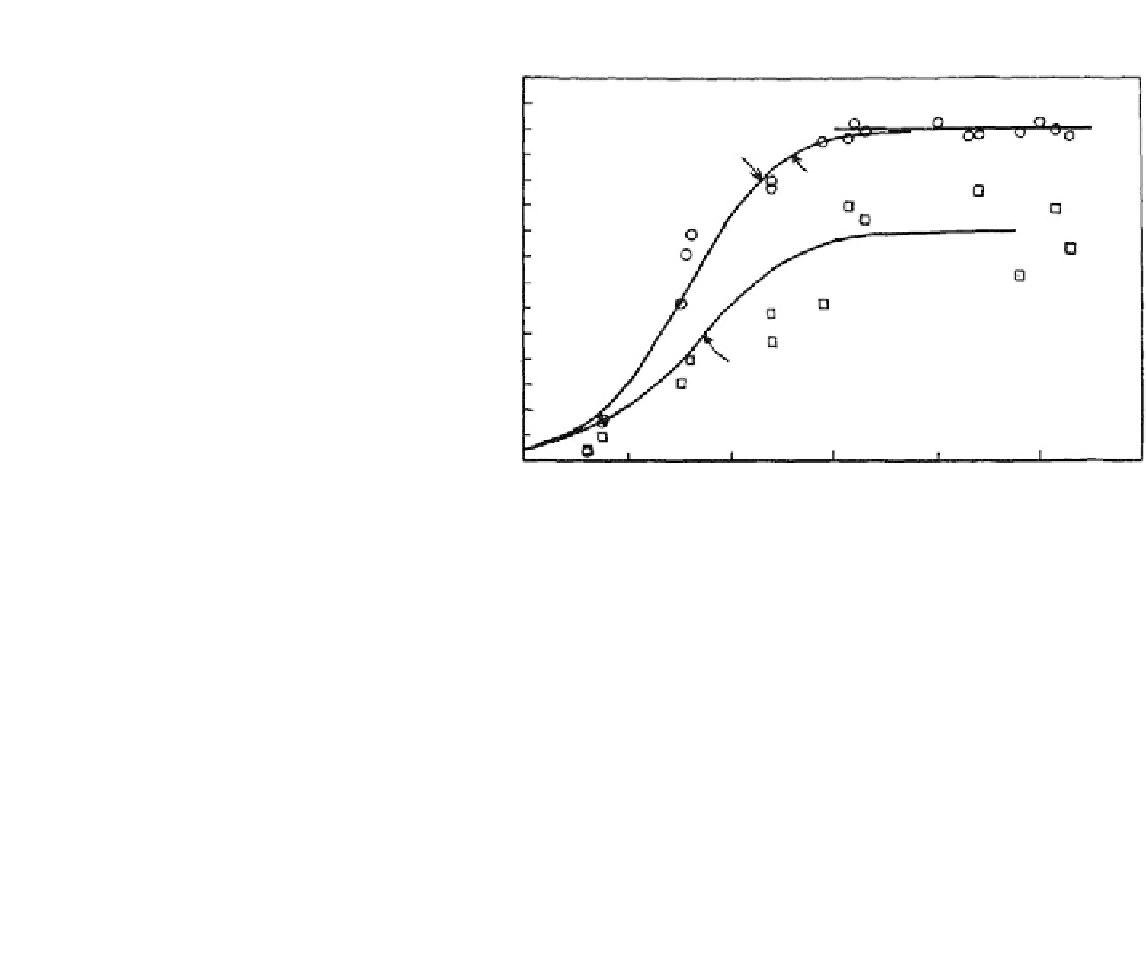
FIGURE 2-23.
Saccharomyces cerevisiae growing alone and in a mixed culture with a population of
Schizosaccharomyces kefir. (From Gause, G. F. [1932]. Experimental studies on the struggle for
existence. I. Mixed population of two species of yeast. Journal of Experimental Biology, 9, 389-402.
Used by permission.)
3. Both species use this resource as their only food supply.
We denote the two species by N and P and let N(t) and P(t) denote the
sizes of their populations at time t.AsN(t) and P(t) change with time, we
begin with:
dN
dt
¼
r
ð
N
;
P
Þ
N
dP
dt
¼
k
ð
N
;
P
Þ
P
:
Here r(N,P) and k(N,P) are the net per capita growth rates of N and P,
respectively. Those rates will depend on the sizes of the two
populations, as emphasized by the chosen notation. Our task will be to
find exact forms for r(N,P) and k(N,P), incorporating the assumptions of
our model.
E
XERCISE
2-14
(a) Assuming food resources are limited, give a mathematical model
describing the growth of population N in the absence of type P
species (P
¼
0).
(b) Repeat, describing the growth of P in the absence of type N species.