Environmental Engineering Reference
In-Depth Information
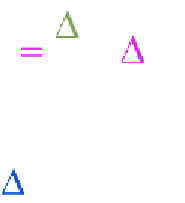
where
P
q
- public acceptance indicator
t
0
- time of sudden change
t
1
- time when public acceptance indicator resume initial value
t
R
PA
2
PA
PA
(13)
where
t
- time interval for the public acceptance indicator recovery
PA
q
- public acceptance indicator sudden change
PA
In the measurement of resilience index it is anticipated that the maximum
change of acceptance indicator
q
max
P
t
= 100 sec,
= 7 % with
PA
In table 1 are presented the maximum values
of the resilience index for the
change of the individual indicators.
Table 9. Resilience Index for maximum indicators change
Indicator change
q
t
RI
PA
PA
Change of the neutron flux
indicator
10x10
13
n/cm
3
sec/100 10
13
n/cm
3
sec
100
5
Change of the reactor pressure
indicator
10atm/160atm
100
3.1
5
Change of the energy cost
indicator
0.0092cEuro/kWh/0.046c
Euro/kWh
100
10
Change of the CO
2
compensation
indicator
10gr/kWh/200grkWh
100
0.2.
5
Change of the acceptance
indicator
0.70/1.0
100
0.0
7


