Environmental Engineering Reference
In-Depth Information
As discussed in Chapter 10, the operation of a large dam is often dictated by the purpose for
which it was constructed, as speciied in the reservoir operations manual developed when the res-
ervoir was constructed and in the reservoir rule curve, which provides target lake level elevations.
In many cases, these operational rules and rule curves were developed without considerations to
the tailwaters. As such, the reservoir may be precluded from operating in a manner consistent with
the optimal management of the tailwater. An example is reservoir releases. If the reservoir is under
drought management, there may be no allowance for minimum releases, an operation that may be
catastrophic to the downstream ishery.
18.2.2 e
roSIon
and
S
cour
One of the issues below dams, particularly for peaking hydropower operations, is the erosion scour
that results from the high, and highly variable, lows and from the dam itself. The presence of the
dam alters the natural sediment transport characteristics of the predammed river by acting as a
sediment trap and reducing sediment loads. Sediment-starved rivers are prone to channel bed and
bank erosion, channel incision, coarsened bed material, and reduced habitat heterogeneity (Collins
and Dunne 1989; Kondolf 1997). Within a short distance from the dam, increased erosion and bank
instability contribute sediments that often block or limit the use of preferred habitat and spawning
areas downstream (Gore et al. 1990).
18.2.3 G
aS
b
ubbLe
d
ISeaSe
Gas bubble disease occurs when ish are exposed to highly or supersaturated gases in water. As
discussed in Chapter 14, gas saturation occurs when equilibrium conditions exist between the gas
phase and the liquid phase, such as with water and the overlying atmosphere. The solubility, or the
liquid concentration at which the liquid is saturated with the gas, varies with the gas characteristics
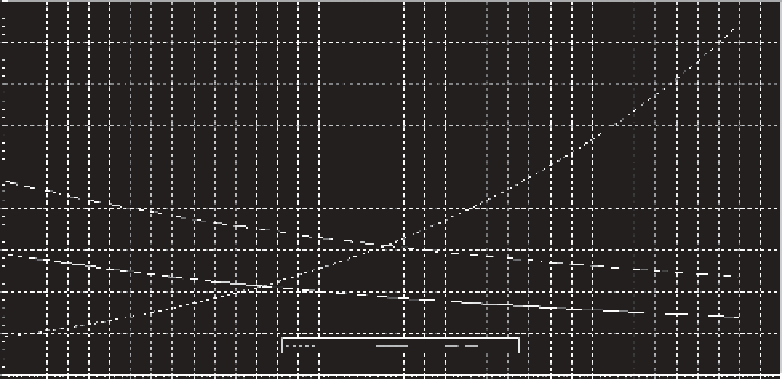
and the gas partial pressure as well as with the temperature, as illustrated in Figure 18.4 for oxygen
and nitrogen at one atmosphere of pressure. Also illustrated is the vapor pressure of water, or the
Atmospheric pressure = 760 mmHg
45
40
35
30
25
20
15
10
5
Water vapor
Oxygen
Nitrogen
0
0
12345678910111213141516171819202122232425262728293031323334
35 36
37
Water temperature (°C)
FIGURE 18.4
Solubility curves for oxygen and nitrogen and water vapor pressure at one atmosphere
pressure. (From Fidler, L.E. and Miller, S.B., British Columbia water quality guidelines for dissolved
gas supersaturation, prepared by Aspen Applied Sciences Ltd. for BC Ministry of Environment, Canada
Department of Fisheries and Oceans, Environment Canada, Canada, 1994.)
Search WWH ::

Custom Search