Environmental Engineering Reference
In-Depth Information
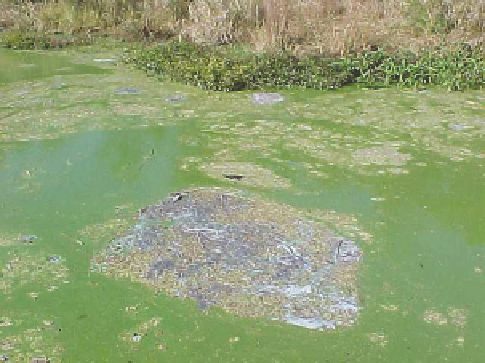
FIGURE 16.1
Example of hypereutrophic system. (From National Eutrophication Monitoring Program—
RQS, Department of Water Affairs and Forestry, South Africa.)
by Carlson (1977) is based primarily on algal biomass (as indicated by chlorophyll-a concentrations)
and the relationships between biomass and nutrients or transparency to light of the water column.
16.1.1.2 Methods for Measuring Biomass or Standing Crop
The standing crop (or standing stock) refers to the mass of organic material that can be sampled
at a particular time (Wetzel 2001). The biomass present is typically measured based on autotroph
enumeration, weight, or pigment (e.g., chlorophyll-a) concentrations. The methods used will vary
depending on the autotroph types, such as planktonic algae, periphyton, and macrophytes.
One common metric is ash-free dry weight (AFDW). First, the dry weight of organic material
is determined by drying at a standardized temperature (e.g., 80°C-105°C). Then, the dry sample is
burned in a furnace (at 550°C) so that only ash remains. The difference between the ash weight and
the dry weight is referred to as the ash-free dry weight (APHA 1999), an approximation of the mass of
organic materials. One dificulty is that without centrifugation or some other means of concentration,
the ash-free dry mass (AFDM) concentrations from planktonic samples are near the detection level
unless the sample is collected from a highly eutrophic stream or lake (Hambrook and Canova 2007).
In addition, it is dificult to distinguish between the mass of algae, bacteria, detritus, and other small
particles, so the use of AFDW measurements is often restricted to larger organisms (Wetzel 2001).
An alternative approach to measuring the AFDM of phytoplankton samples is to obtain a mea-
sure of carbon by an analysis of particulate organic carbon (POC). This typically involves iltration
to obtain a particulate sample, an analysis for total POC followed by an analysis for particulate
inorganic carbon, with the POC concentration determined by the difference. Some assumed stoi-
chiometry may then be used (e.g., as in Equation 16.1) to relate the carbon to the dry (or wet) weight
biomass.
Another commonly used metric is based on direct enumeration, counting, or volume determina-
tions. The abundance, for phytoplankton, is commonly expressed as a biovolume of all individu-
als. Some of the techniques for enumeration were discussed in Chapter 15, and are discussed in
detail in Vollenweider's (1969)
Manual on Methods for Measuring Primary Production in Aquatic
Environments
. While commonly used, biovolumes are poor indicators of the biomass of macro-
phytes because of the variability in internal gas spaces (Wetzel 2001).
Cellular contents, such as chlorophyll-a, are also commonly used metrics for biomass. The biomass is
estimated using some assumed relationship between biomass and chlorophyll or carbon and chlorophyll
(the carbon/chlorophyll ratio). A number of cellular constituents have been employed to estimate biomass.
However, with the exception of carbon, measures using other constituents are complicated by the extreme
Search WWH ::

Custom Search