Environmental Engineering Reference
In-Depth Information
known as methanogenesis. As indicated in Table 14.3, this is the last most thermodynamically
attractive oxidation pathway, so it generally only occurs after other TEAs (oxidants, e.g., O
2
,
NO, MnO
2
, FeO(OH), and SO
4
) are depleted and while hydrogen (H
2
) and carbon dioxide (CO
2
)
accumulate.
The general reaction is
CO 4H
+→ +
CH 2H O
(14.20)
2
2
4
2
where CO
2
is the TEA (Table 14.3) and methane is the end product. However, methane may also be
produced by the destruction of organic carbon (generalized as CH
2
O in Equation 14.22) and organic
acids, represented by (assuming complete destruction of the organic acids; Di Toro 2001):
CHOH O
2
→+
1
2
1
2
(14.21)
4
2
Once produced, if the methane enters an oxic environment it can create an oxygen demand, as by
1
2
CH O
+→+
1
2
COHO
+
(14.22)
4
2
2
2
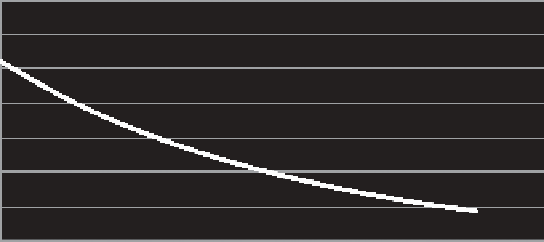
Methane is relatively insoluble in water (Figure 14.32), so it may escape from the water col-
umn and sediments via degassing from the surface. St. Louis et al. (2000) noted that the global
average areal methane lux from the surface of reservoirs to the atmosphere was approximately
120 mg CH
4
m
-2
day
-1
, whereas natural lakes averaged only 9 mg CH
4
m
-2
day
-1
, suggesting that
reservoirs may serve as anthropogenic sources of this greenhouse gas. An alternative pathway is
from the ebullition of methane from saturated releases of bottom waters. In their study of a Swiss
hydropower facility, Adelsontro et al. (2010) reported that releases through the surface and turbines
combined generated total methane emissions on warm summer days of up to 500 mg CH
4
m
-2
day
-1
,
which averaged >150 mg CH
4
m
-2
day
-1
. Adelsontro et al. (2010) further indicated that the source of
the methane was almost entirely bubbling from sediments.
Methanogenesis in sediments can also contribute to the methylation of mercury, if present.
Methylmercury is a bioaccumulative toxicant and excess concentrations have resulted in ish con-
sumption advisories in a number of systems.
Methane solubility
50.0
45.0
40.0
35.0
30.0
25.0
20.0
15.0
0
5
10
15
Te mperature (°C)
20
25
30
35
40
FIGURE 14.32
Methane solubility. (Computed from Yamamoto, S., Alcauskas, J.B., and Crozier, T.E.,
Journal of Chemical & Engineering Data
, 21, 78-80, 1976.)


Search WWH ::

Custom Search