Environmental Engineering Reference
In-Depth Information
0.5
0.9
1.0
1.2
0.5
0.5
0.9
0.9
0.9
1.2
1.2
1.2
1.3
1.3
0.4
0.4
0.4
0.4
1.5
1.5
1.7
1.7
1.6
1.6
1.5
1.5
2.1
2.1
1.8
1.8
0.7
0.7
1.9
1.9
0.4
0.4
1.3
1.3
2.7
2.4
2.7
2.4
2.0
2.0
2.9
2.8
2.6
2.9
2.8
2.6
2.3
2.3
2.4
2.4
0.4
0.4
3.0
3.0
2.7
2.7
3.4
3.4
0.5
0.5
0.5
0.5
3.1
3.1
0.6
1.3
0.6
1.3
2.7
2.7
0.4
0.4
3.3
3.3
0.7
0.6
0.7
0.6
0.9
0.9
2.0
2.0
2.8
2.8
2.3
2.3
2.9
2.9
Concentration
3.3
3.3
2.6
2.6
2.6
2.8
2.8
3.0
3.0
2.6
2.6
0.5
2.9
2.9
2.7
2.7
0.5
4.0
3.5
3.0
2.5
2.0
1.5
1.0
0.5
0.0
2.7
2.7
2.5
2.5
0.9
0.9
2.4
2.4
2.4
2.4
0.7
0.7
2.3
2.3
2.6
2.6
2.6
2.6
1.5
1.5
2.1
2.1
2.1
2.1
2.4
2.4
2.4
2.4
2.9
2.9
0.9
0.9
2.7
2.7
3.2
3.2
2.4
2.4
1.7
1.7
Site not pictured:
2.6
DEN417, AK
0.4
2.1
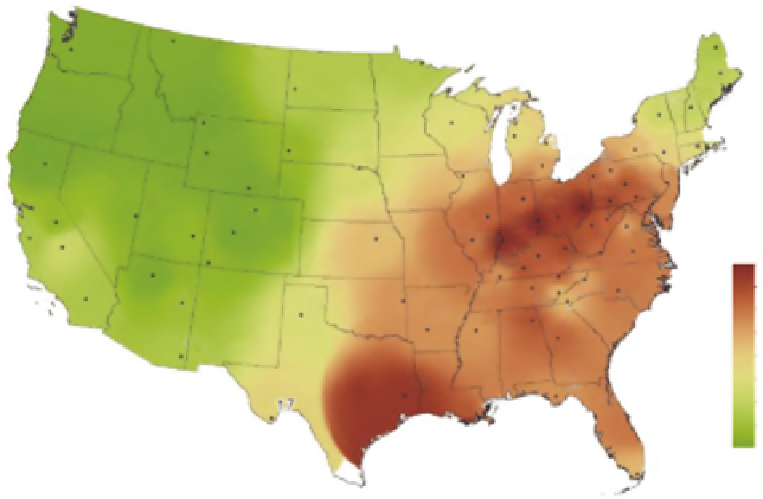
FIGURE 14.30
Annual mean sulfate concentrations for 2011. (From AMEC, Clean air status and trends
network annual report, AMEC Environment & Infrastructure, Inc., Prepared for the U.S. Environmental
Protection Agency Ofice of Air and Radiation, Washington, DC, 2011.)
The forms of sulide may be unionized hydrogen sulide at lower pH values, or ionized forms
(e.g., HS
−
) at higher pH values. The presence of sulide is problematic since even at small concentra-
tions it creates taste and odor (it is the “rotten egg gas”) problems. Sulides are also toxicants, and
the tolerance of aquatic organisms varies between species and life stages. The U.S. EPA (USEPA
1986) recommended that an aquatic life criterion for chronic conditions (the criterion continuous
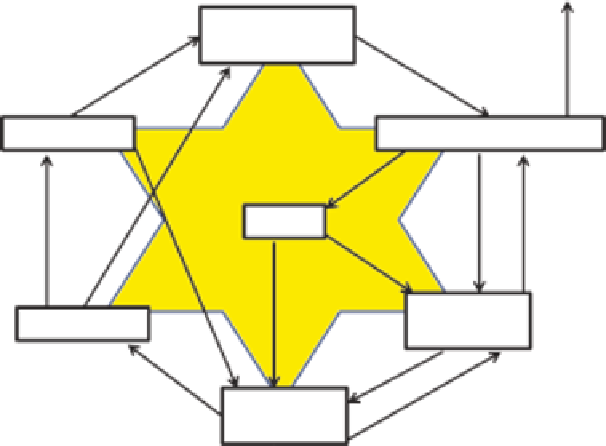
Degassing
Nonliving
organic matter
Decomposition
Death
Sulfide
(H
2
S, HS
-
, S
2-
)
Heterotrophs
Microbial
action
Death
Sulfur
Uptake
Excretion
Microbial
oxidation
Sulfites
(SO
2
, SO
2-
)
Autotrophs
Uptake
Sulfates
(SO
3
, SO
2-
)
FIGURE 14.31
Generalized sulfur cycle.


Search WWH ::

Custom Search