Environmental Engineering Reference
In-Depth Information
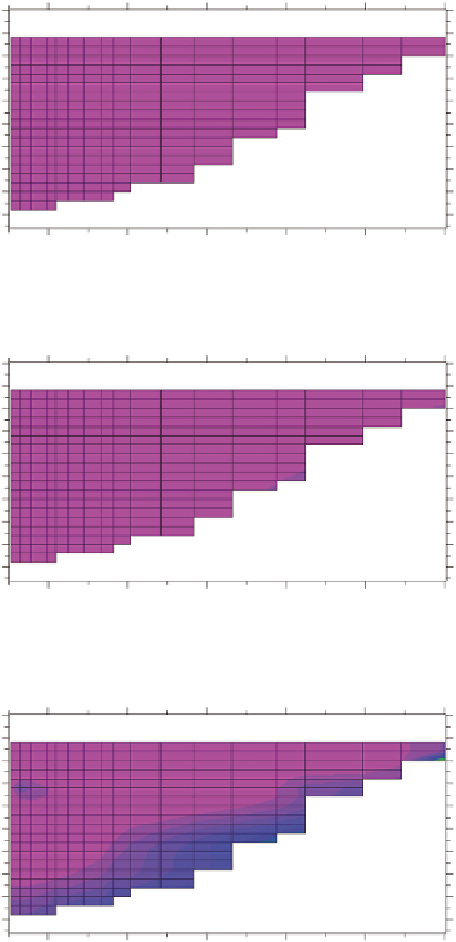
Ammonium at 03/31/1995 23:04
Distance (m)
50,000
40,000
30,000
20,000
10,000
0
0
0
5
5
10
10
15
15
1.42
1.38
1.34
1.30
1.26
1.22
1.19
1.15
1.11
1.07
1.03
0.990
0.951
0.912
0.873
0.834
0.795
0.755
0.716
0.677
0.638
0.599
0.560
0.521
0.482
0.442
0.403
0.364
0.325
0.286
0.247
0.208
0.169
0.130
0.0905
0.0513
20
20
25
25
30
30
35
35
40
40
3/31/1995
45
45
50,000
40,000
30,000
20,000
10,000
0
Distance (m)
Ammonium at 05/31/1995 23:01
Distance (m)
50,000
40,000
30,000
20,000
10,000
0
0
0
5
5
10
10
15
15
20
20
25
25
30
30
35
35
40
40
5/31/1995
45
45
50,000
40,000
30,000
20,000
Distance (m)
10,000
0
Ammonium at 07/31/1995 23:00
Distance (m)
50,000
40,000
30,000
20,000
10,000
0
0
0
5
5
10
10
15
15
20
20
25
25
30
30
35
35
40
40
7/31/1995
45
45
50,000
40,000
30,000
20,000
Distance (m)
10,000
0
(a)
FIGURE 14.29
(a,b) Predicted ammonia-N concentrations in Lake Lanier, Georgia, for selected dates in
1995. (From Martin, J.L. and Hesterlee, C., Detailed reservoir water quality modeling to support environ-
mental impact statements for the evaluation of ACT and ACF river basins water allocation, Contract Report
prepared for the U.S. Army Engineer District, Mobile, 1988.)
14.7 pH, ALKALINITY, AND CO
2
The pH of lakes is impacted by a number of biological (e.g., autotrophic or heterotrophic productiv-
ity and respiration) and chemical processes as well as by external loadings. Changes in the pH have
a variety of impacts on the chemical and biological characteristics of lakes. The pH may control

Search WWH ::

Custom Search