Environmental Engineering Reference
In-Depth Information
3.16
3.08
2.99
2.90
2.82
2.73
2.64
2.55
2.47
2.30
2.29
2.21
2.12
2.03
1.94
1.86
1.77
1.68
1.60
1.51
1.42
1.33
1.25
1.16
1.07
0.906
0.899
0.811
0.724
0.637
0.550
0.463
0.376
0.289
0.201
0.114
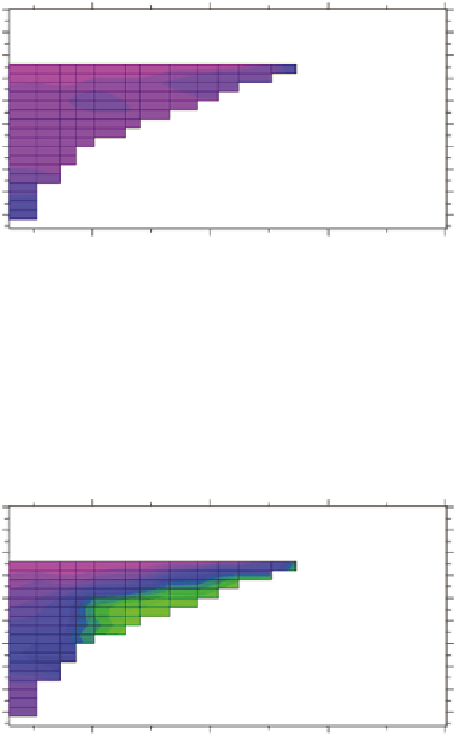
Nitrate-nitrite at 07/31/1995 23:02
Distance (m)
30,000
20,000
10,000
0
0
0
5
5
10
10
15
15
20
20
25
25
30
30
35
35
40
40
45
45
30,000
20,000
10,000
0
Distance (m)
(a)
Allatoona Reservoir, GA, predicted nitrate-N concentrations (mg L
-1
) for July 31, 1995
0.024
0.805
0.702
0.760
0.737
0.714
0.691
0.664
0.646
0.623
0.600
0.577
0.554
0.532
0.509
0.486
0.463
0.440
0.410
0.395
0.372
0.349
0.326
0.304
0.281
0.254
0.235
0.212
0.194
0.167
0.144
0.121
0.0983
0.0755
0.0527
0.0299
Ammonium at 07/31/1995 23:02
Distance (m)
30,000
20,000
10,000
0
0
0
5
5
10
10
15
15
20
20
25
25
30
30
35
35
40
40
45
45
30,000
20,000
10,000
0
Distance (m)
(b)
Allatoona Reservoir, GA, predicted ammonia-N concentrations (mg L
-1
) for July 31, 1995
FIGURE 14.27
(a,b) Predicted nitrate-N and ammonia-N concentrations in Lake Allatoona, Georgia, for
July 31, 1995. (From Martin, J.L. and Hesterlee, C., Detailed reservoir water quality modeling to support
environmental impact statements for the evaluation of ACT and ACF river basins water allocation, Contract
Report prepared for the U.S. Army Engineer District, Mobile, 1988.)
14.6.1 S
eaSonaL
d
IStrIbutIon
The trophic status of lakes and reservoirs is largely a function of the phosphorus concentrations,
and the temporal and spatial distribution of phosphorus is largely impacted, in turn, by those
trophic conditions. In an oligotrophic lake, the phosphorus concentrations would be relatively con-
stant. For a eutrophic lake, phosphorus would be much more variable and would be expected to be
in relatively low concentrations during seasons and in areas of greatest productivity (epilimnion,

Search WWH ::

Custom Search