Environmental Engineering Reference
In-Depth Information
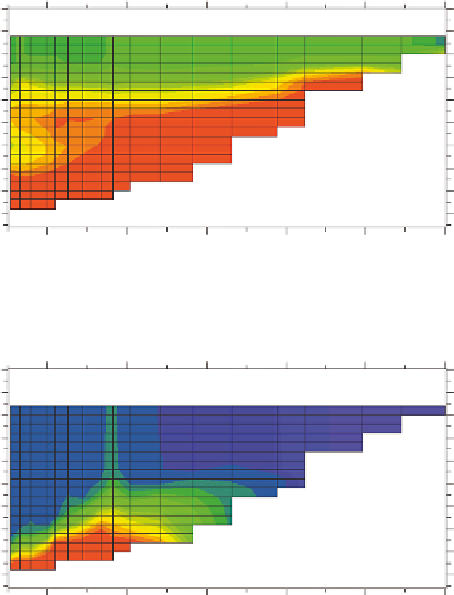
Dissolved_oxygen at 07/31/1995 23:00
Distance (m)
50,000
40,000
30,000
20,000
10,000
0
0
0
5
5
10
10
15
15
20
20
25
25
30
30
35
35
40
45
40
45
9/30/1995
50,000
40,000
30,000
20,000
10,000
0
Distance (m)
Dissolved_oxygen at 11/30/1995 23:00
Distance (m)
50,000
40,000
30,000
20,000
10,000
0
0
0
5
5
10
10
15
15
20
20
25
25
30
30
35
35
40
45
40
45
11/30/1995
50,000
40,000
30,000
20,000
10,000
0
(b)
Distance (m)
FIGURE 14.17
(Continued)
ammonia, particulate nitrate and ammonium compounds, and organic nitrogen. These forms can
serve as sources or sinks for nitrogen in lakes and reservoirs, such as through gas exchange, and wet
and dry deposition.
The processes impacting the gas exchange of molecular nitrogen are similar to those impacting
the gas exchange of oxygen. The exchange is a function of turbulent mixing at the water surface,
such as due to wind and waves (or, as discussed in the chapter on tailwaters, water plunging over
the dam) and the concentration gradient between the water column and the atmosphere. As with
oxygen, the solubility of nitrogen is a function of the temperature and pressure, and the computa-
tion is described in the American Fisheries Society's
Computation of Dissolved Gas in Water as
Functions of Temperature Salinity and Pressure
(AFS 1984). The molecular nitrogen in water is
also impacted by denitriication, a source of N
2
(Figure 14.22), and can be lost by the uptake of some
plankton, such as some cyanobacteria (see Chapter 16), which can ix atmospheric nitrogen.
In addition to gas exchange, atmospheric wet and dry deposition can serve as an important
source of nitrogen to lakes and reservoirs (a nutrient) as well as a source of lake acidiication (e.g.,
by nitrous oxides; USEPA 2008, 2009). Particularly for large lakes, the atmosphere can serve as a
substantial source of nutrient loads. The National Atmospheric Deposition Program monitors wet
atmospheric deposition of nitrogen, as illustrated by the rates of wet deposition for 2006 in Figure
14.23. In addition, in 2010 the Ammonia Monitoring Network (AMoN) was established to monitor
ammonia gas concentrations across the United States.
Search WWH ::

Custom Search