Environmental Engineering Reference
In-Depth Information
July 2006
330
Dissolved
oxygen
maximum
305
280
255
230
5
15
25
35
0
5
10
15
October 2006
330
305
Dissolved
oxygen
maximum
280
Average
Maximum
Minimum
Lake stage
Lake bottom
255
230
5
15 25
Te mperature (°C)
35
0
5
10
15
Dissolved oxygen (mg L
-1
)
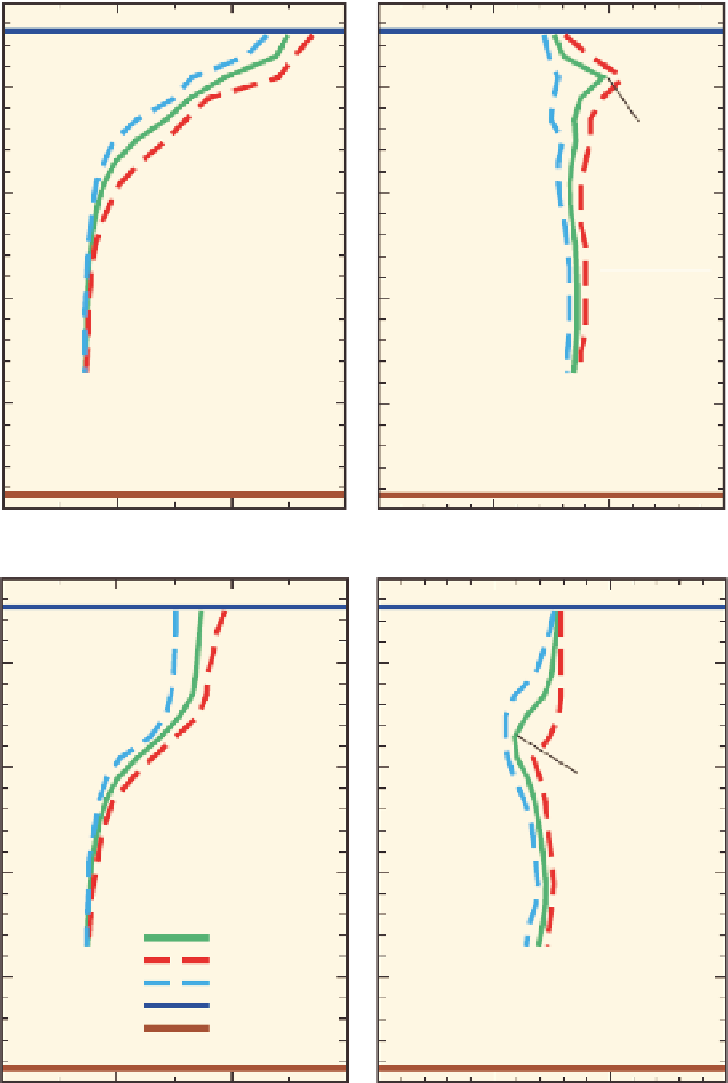
FIGURE 14.15
Illustration of dissolved oxygen maximums and minimums at the U.S. Geological Survey
Virgin Basin station on Lake Mead for July 2006 and October 2006. (From Veley, R.J. and Moran, M.J.,
Evaluating lake stratiication and temporal trends by using near-continuous water-quality data from auto-
mated proiling systems for water years 2005-2009, Lake Mead, Arizona and Nevada, U.S. Geological
Survey, Carson City, NV, 2011.)
Search WWH ::

Custom Search