Environmental Engineering Reference
In-Depth Information
0.0
11.0
10.0
0.5
9.0
8.0
1.0
7.0
7.0
1.5
2.0
6.0
6.0
2.5
5.0
4.0
3.0
900
1315
1700
2100
100
500
900
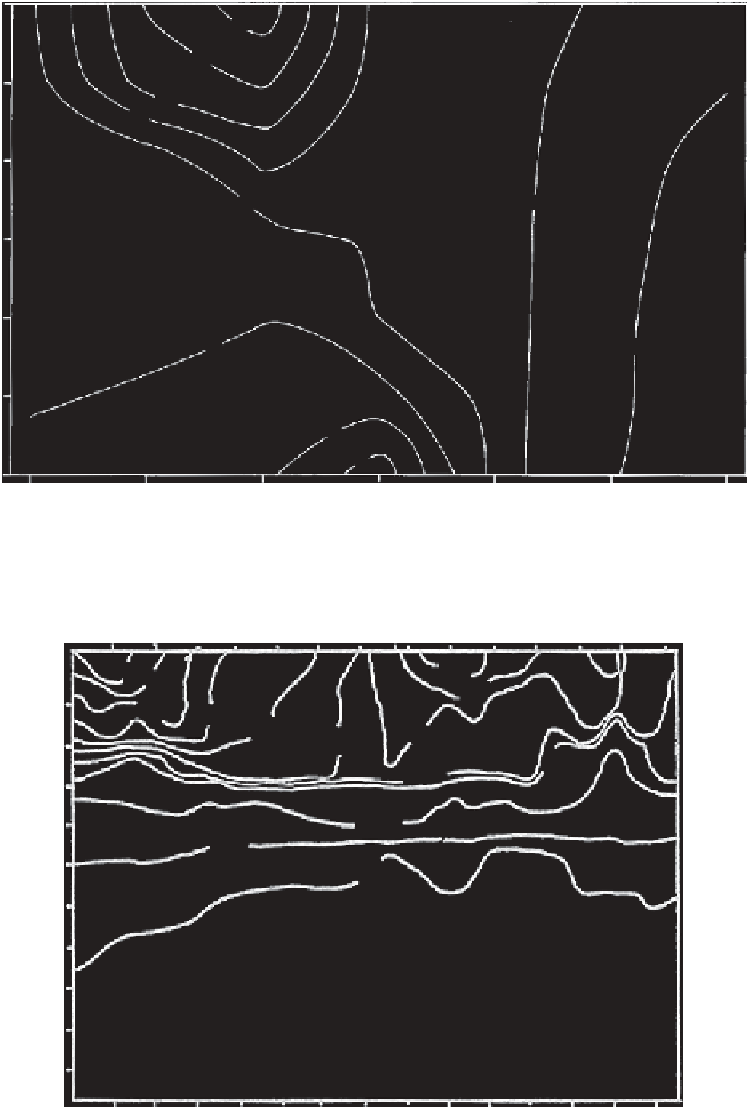
FIGURE 14.10
Variations in dissolved oxygen concentrations at Station 22 of Lake Kissimmee, Florida,
July 16-17, 1974. (From Dye, C.W., Jones, D.A., Ross, L.T., and Gernert, J.L.,
Hydrobiologia
71, 51-60, 1980.
With permission.)
0
125
110
105
2
115
110
105
100
100
4
90
95
6
50
8
10
10
0
12
14
16
18
20
6
8
10
12
246
8 0 2
246810
p.m.
June 30
a.m.
July 1
p.m.
Time (h)
FIGURE 14.11
Measured variations in the percentage of oxygen saturation during July 1983, for Lake
Livingston, Texas. (From Martin, J.L., Models of diel variations of water quality in a stratiied eutrophic res-
ervoir (Lake Livingston, Texas), PhD. dissertation, Texas A&M University, 1984.)
Search WWH ::

Custom Search