Environmental Engineering Reference
In-Depth Information
12
10
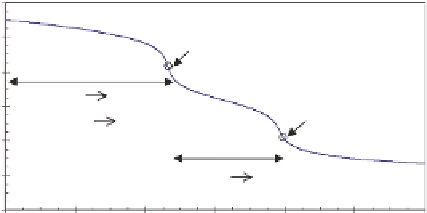
Phenolphthalein end point
8
H
+
+
OH
-
H
2
O
HCO
-
6
Methyl orange
end point
H
+
+
CO
2
-
4
H
+
+
HCO
-
2
H
2
CO
3
0
0
1
2
Acid added (mEq L
-1
)
3
4
5
6
FIGURE 5.32
Alkalinity titration curve.
while if the system were highly buffered (high alkalinity), the pH would change very little or not at
all until enough acid is added to overload the buffering capacity.
One prevalent problem due to emissions of sulfur dioxide (SO
2
) and nitrogen oxide (NO
2
) resulting
from fossil fuel combustion into the atmosphere is the formation of acids, which are then deposited
on surfaces by dry or wet deposition (acid rain) (Figure 5.33). Acid rain has resulted in the acidiica-
tion of a large number of rivers, streams, and other waterbodies in the United States, Canada, and
elsewhere, primarily those waterbodies with relatively little buffering capacity. Waterbodies in the
southern United States, for example, where there is a greater prevalence of limestone (CaCO
3
), have
higher buffering capacities and a resistance to acidiication. Acidiication may have direct or indi-
rect impacts on aquatic organisms. For example, in acid environments, toxic forms of metals such
as aluminum may result in toxic impacts.
Acid mine drainage is another common problem affecting rivers and streams, resulting from the
mining of coal or metals. Some have described the formation of acid drainage and the contaminants
associated with it as the largest environmental problem facing the U.S. mining industry (USEPA
1994). In many areas, such as some western states, the very patchy distribution of tailings from
abandoned mines and the resulting drainage are a pervasive problem.
Changes in pH also occur over seasons and over diel cycles in the water column and sediments
due to productivity and respiration, during which CO
2
is taken up or released. In some cases, these
Particulate
pollutants in
atmosphere
Gaseous
pollutants in
atmosphere
Sources
Pollutants in
cloud water
and
precipitation
We t
deposition
NO
X
VOC
Hg
NO
X
VOC
SO
2
Natural
Receptors
Anthropogenic
FIGURE 5.33
Acid rain. (From USEPA, Available at http://www.epa.gov/acidrain/what/index.html. With
permission.)

Search WWH ::

Custom Search