Environmental Engineering Reference
In-Depth Information
Miles
94,182
61,748
48,957
42,752
39,120
35,301
34,556
27,522
22,691
22,559
Agriculture
Hydromodification
Unknown/unspecified
Habitat alteration
Natural/wildlife
Municipal discharges/sewage
Unspecified nonpoint source
Atmospheric deposition
Resource extraction
Urban runoff/stormwater
05
Percent of impaired stream miles affected
10
15
20
25
30
35
40
45
FIGURE 5.12
Listing of sources of impairments from the national water quality inventory: Report to
Congress 2004.
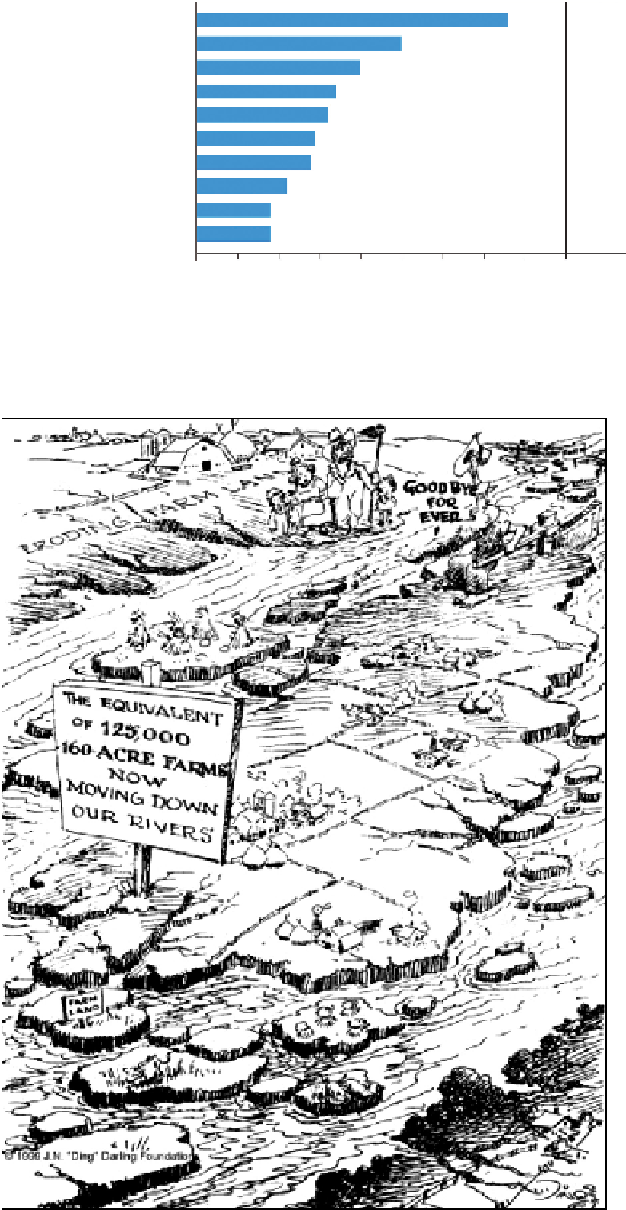
FIGURE 5.13
“What that mud in our rivers adds up to each year” cartoon by J.N. (Ding) Darling from the
1930s. (Courtesy of the Jay N. “Ding” Darling Wildlife Society.)
Search WWH ::

Custom Search