Environmental Engineering Reference
In-Depth Information
values at hundreds of precipitation monitoring stations in the United States and southern Canada. In
the eastern part of the continent the location of the stations was so dense that only the pH isocontours
are drawn around the stations. It is seen that in the center of the eastern United States the pH 4.2
isocontour prevailed, whereas the pH 4.4 isocontour encompassed almost all northeastern states and
southern Ontario and Quebec. This is in good agreement with the estimates obtained from (9.20).
In the western United States the average ion concentrations were lower, and usually the nitrate to
sulfate concentration ratios were larger than those in the eastern United States. Figure 9.9(a) shows
that in the western United States the measured pH values were in the range pH 5.0-5.5.
The average acidity of precipitation (i.e. the pH) is only a partial indication of the acid deposition
problem. A better assessment of the problem is the annual deposition rate of hydrogen ions. Lakes
and other surface waters are acidified cumulatively while being exposed (“titrated”) to years of acid
deposition and exhaustion of their alkalinity content. Episodic deposition rates of hydrogen ions
are obtained by multiplying the average hydrogen ion concentrations in each precipitation episode
by the amount of precipitation in that episode. Usually, hydrogen ion depositions are measured in a
bucket that collects all precipitation that falls over a week. Annual deposition rates are obtained by
summing the weekly deposition rates over a year. Figure 9.9(b) shows the 1986 annual hydrogen
deposition rates across the United States and southern Canada in units of kilograms per hectare
(10,000 m
2
). The isocontours stretch more toward the northeast than the pH isocontours. This is most
likely due to the higher precipitation rates in the northeastern United States than in the Midwest.
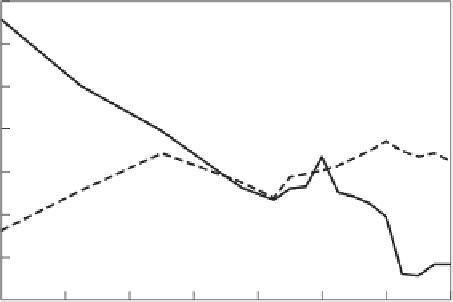
Figure 9.10 shows the trend of SO
2
and NO
x
(reckoned as NO
2
) emission rates in the United
States for the years 1970-1996. In 1970, SO
2
emission rates reached more than 30 million short tons
per year, but fell steadily thereafter as a consequence of (a) installing SO
2
control technology on all
new coal-fired power plants and (b) retrofitting existing plants as required by the 1990 Clean Air
Act Amendments. Concomitantly, the sulfate and hydrogen ion deposition rates decreased slowly.
When the acid deposition section (Title IV) of the 1990 CAAA is fully implemented in the early
2000s, the nationwide SO
2
emission rates are expected to be about one-half those of 1970. NO
x
emissions reached a peak in 1980 of about 24 million short tons per year, and they have hovered
around that mark ever since. Assuming that sulfate ion depositions will decrease by one-half and
that nitrogen ion depositions remain constant, in the early 2000s hydrogen ion deposition rates will
32
30
SO
2
28
26
24
NO
x
22
20
18
1970
1974
1978
1982
1986
1990
1994
1998
Figure 9.10
Trend of SO
2
and NO
2
annual emissions in the United States, 1970-1998. (Adapted from EPA,
2000.
National Air Pollutant Emission Trends: 1900-1998, EPA 454/R-00-002.
Washington, D.C.: USEPA.)