Environmental Engineering Reference
In-Depth Information
200
150
100
50
0
0
50
100
150
200
Ozone observed (ppb)
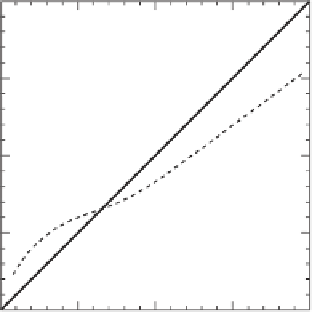
Figure 9.7
Modeled versus observed O
3
concentrations (dotted line) from ROM. (Adapted from National
Research Council. 1991.
Rethinking the Ozone Problem in Urban and Regional Air Pollution
. Washington,
D.C.: National Academy Press.)
meteorological episode lasting 3-5 days, usually terminating with a precipitation event. Figure 9.7
shows the average comparison between 15,000 measured and modeled data points using ROM.
While there is a fairly good correlation between observations and predictions, there is a tendency
to overpredict at low concentrations and underpredict at high concentrations.
The grid models bring out clearly that ozone is a regional problem that can only be solved with
a regional emission reduction strategy. Because of transport of the precursors NO
x
and VOC and
of the formed ozone itself, high concentrations in the tens and hundreds ppbV are observed not
only in urban areas, but in rural and remote areas, at lower and higher elevations, and even over
the sea. Peak concentrations are not only encountered in mid-afternoon hours as the EKMA model
would predict, but are also encountered at practically all hours of the day and night.
In areas where the VOC/NO
x
ratio is high, NO
x
control provides more ozone reduction; in areas
with a low VOC/NO
x
ratio, VOC control appears more effective. In rural and remote areas where
the availability of VOC is plentiful from biogenic sources, NO
x
availability is the limiting factor to
ozone production. This is so because in chemical kinetics the reactant in short supply determines
the rate of the reaction. For a subcontinental region, such as the northeastern or southeastern United
States, the diurnal and seasonal average ozone concentrations can only be substantially reduced by
region-wide NO
x
emission reductions. This is because on a regional basis, biogenic VOC emission
can predominate over anthropogenic VOC emissions.
While in the United States and other developed countries great strides have been taken to
reduce NO
x
emissions from both stationary and mobile sources, ambient NO
x
concentrations in
the United States and worldwide are either on the increase or at best are level (see Figure 9.10 for
NO
x
emission trends in the United States). This is because what is gained in NO
x
control technology
is lost in the ever increasing number of NO
x
emitting sources, especially automobiles. In the United
States, for example, the highway vehicle population has been increasing at a rate of 3.4 million
vehicles per year during the period 1950-1995. In the United States it remains to be seen whether
in the future the current ozone standard of 120 ppbV, 1-h average, will not be exceeded, let alone
the proposed new standard, 80 ppbV, 8-h average.