Environmental Engineering Reference
In-Depth Information
Ozone
(ppb)
VOC
NO
x
0.24
= 8:1
VOC
= 4:1
NO
x
400
0.20
VOC
0.16
360
340
320
300
280
240
200
180
120
80
0.12
NO
x
VOC
NO
x
= 16:1
0.08
0.04
0.0
0.0
0.2
0.4
0.6
0.8
1.0
1.2
1.4
1.6
1.8
2.0
VOC (ppmC)
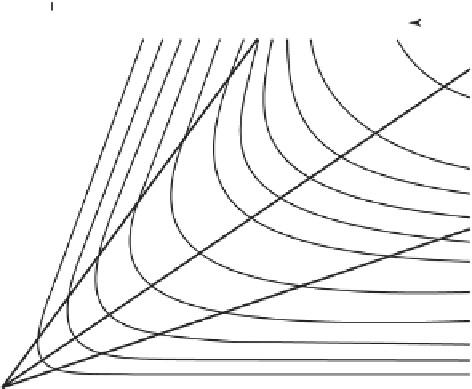
Figure 9.6
EKMA plot of the maximum ozone concentration as a function of the initial NO
x
and VOC
concentrations.
a smaller reduction of NO
x
would be necessary. (A third way would be to go along the diagonal
from the 200 ppbV isopleth to the 120 ppbV isopleth. This would require reductions of both VOC
and NO
x
, albeit in lesser quantities than by reducing only one kind of pollutant.)
The shortcomings of EKMA are that it models the ozone concentrations only within a partic-
ular air column, and only for a single day. Because NO
x
is not appreciably destroyed in the ozone
formation cycle, the NO
x
just keeps moving downwind with the column of air. The transported NO
x
will participate in ozone formation further downwind on the same day, and even on subsequent
days, because its lifetime can be several days, depending on atmospheric conditions and compo-
sition. This is the reason that rural and remote areas far downwind from metropolitan areas also
experience high concentrations of ozone, even though the emissions of NO
x
in those areas may be
quite small.
Because of the shortcomings of EKMA, regulatory agencies in the United States and other
countries rely now on more sophisticated models that cover much larger areas than a single air
column and also cover a longer time period, usually selected to simulate an elevated pollution
episode. Such models are of the Eulerian type, in which the coordinate system remains fixed, and
the area covered is divided into grid cells. One such model is called the Urban Airshed Model
(UAM), and another is called the Regional Oxidant Model (ROM). These models cover an area of
several degrees latitude and longitude with variable size grid elements, down to 2 km
2
. Vertically,
the models are divided into several layers below and above the mixing height. The model inputs
are the wind field in the modeled area, temperature, humidity, terrain roughness and vegetation
cover (the latter affect deposition rates), emission inventory, and the background level of ozone.
The governing chemical reactions are quite similar to EKMA, with eight VOC categories. These
models can predict the time profile of ozone over a selected location, or produce a contour map
of maximum concentrations over the whole modeling domain. The time domain of the model is a