Environmental Engineering Reference
In-Depth Information
insolation lead to neutral categories C or D. At night, the stability categories are almost always
neutral or stable: D, E, or F. Table 9.5 also lists the temperature gradients which correspond to the
stability categories.
9.2.4.2 Modeling of Steady-State Point Source
When an effluent from a power plant stack leaves the top exit of the stack, it immediately begins to
mix with the surrounding atmosphere, because the effluent jet velocity is different from that of the
surrounding atmosphere. This mixing process begins to dilute the concentration of the stack gas,
the more so the more atmospheric air is entrained in the stack plume. Most of the time a wind is
present so that the plume, as it mixes with the atmosphere, soon attains the horizontal speed
u
of the
wind, with the plume axis (or centerline) bending sharply and approaching the horizontal direction.
At this point in the plume trajectory, mixing of the plume gas with the atmosphere continues at
a rate determined by the turbulent motion of the atmosphere. As a consequence of this mixing
process, the concentration of the plume gas, a mixture of the principal products of combustion
and the air pollutants of interest, steadily declines with downwind distance from the stack exit.
The physical evidence of this mixing is visible to the eye for smoky plumes, where it can be seen
that the plume width in both vertical and horizontal directions increases with downwind distance,
marking the portion of the surrounding atmosphere into which the effluent gas has been mixed and
thereby diluted.
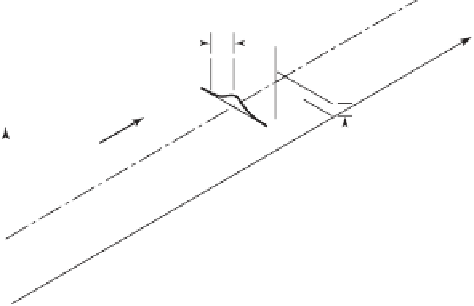
Measurements of the pollutant gas concentrations downwind of stacks show that, at any dis-
tance
x
downwind, they are maximum at the plume centerline and decline with vertical or lateral
distance from the plume centerline. The centerline concentration and the effective vertical and
horizontal widths of plume change gradually with the distance
x
, in a way that is dependent upon
the atmospheric conditions. The concentration profile in both the
y
and
z
direction can be approx-
imated by a Gaussian (bell-shaped) curve. To generalize the results of such plume measurements,
a mathematical model, called the Gaussian plume model, has been developed.
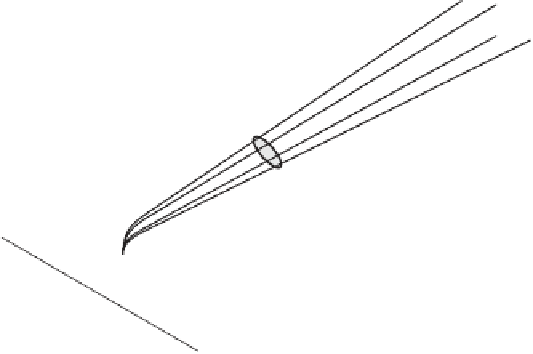
A smoke stack plume is depicted in Figure 9.1. The stack is placed at the origin of the coordinate
system, with the
x
axis downwind, the
y
axis crosswind, and the
z
axis is in the vertical. The stack
L
x
y
z
z
u
y
h
H
h
Figure 9.1
The Gaussian plume.