Information Technology Reference
In-Depth Information
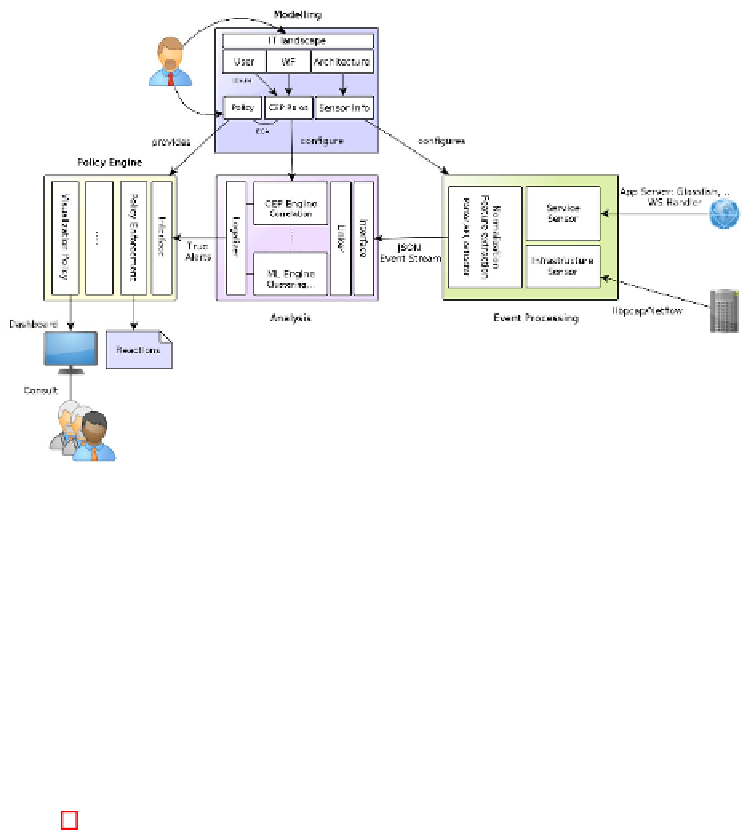
Fig. 4.
Overview of the monitoring architecture
the width and the threshold for anomalies, tweaking either of them will reduce
false-positives. An increased cluster-width allows sparse clusters, exhibiting a
significant higher variance, to be normal. Rising the threshold allows to have
clusters with few instances to be normal as well. Another option is the creation
of tests to determine the true state of an entity, but that is left for future work.
If a cluster, and the ensuing entities within, are still labeled as anomalies the
framework provides to relabel them as normal.
3 Architecture
Figure 4 indicates the different components of our monitoring architecture, which
can be offered by a cloud provider as a
Monitoring as a Service
solution. A
tenant uses the DSL provided by the
modeling component
to provide a model
which describes his IT landscape. This model is aligned to the three layers we
discussed above. Based on the model, rules to detect workflow non-compliance
are created to configure the CEP engine. To customize the monitoring service,
the tenant supplies the
policy engine
with policies (which are rules or metrics)
to enable the cloud provider to react on alerts. Policies specify (i) the gravity of
alerts and (ii) what should happen in case they happen. By providing a policy, a
tenant bids the cloud provider to cut off a virtual host from the network, if said
host is classified as an information leaking host. This state can be mantained
until the host is classified as normal. The
event processing
component consists
of service and network sensors as well as a normalization feature extraction
element. The sensors act as event sinks for multiple service and network event
Search WWH ::

Custom Search