Environmental Engineering Reference
In-Depth Information
(b)
Water samples
96-well plate
Sample library information
Well location, conc., etc
Multidrop
Distribute cells
to wells
Janus
Resuspend,
reformat
MATLAB
conversion
program
Janus compatible
instruction file
Janus compatible
instruction file
assign control wells
Daughter data file
Well location, conc., etc
Aliquoted samples
384-well plate
Input data
for
cellHTS2
MATLAB data
management
program
Assay plate info
Barcodes, etc
Imaging plate set
CellHTS2
analysis package
R
Image
analysis
Acapella or
MATLAB
OPERA
microscopy
system
Image
database
Measurement
files
12345678910
A
B
C
D
E
F
G
H
Screen
results
(c)
GFP-GR
Hydrocortisone
5
Dexamethasone
4
Corticosterone
3
2
1
0
0
1
3
5
Concentration (nM)
10
15
20
FIGURE 35.3
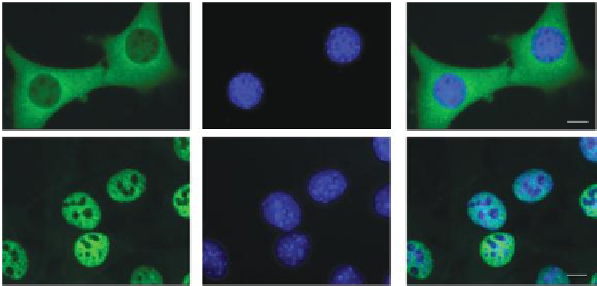
Application of the translocation assay for analysis of EDCs in water samples. (a) GFP-tagged glucocorticoid
receptor (GFP-GR) translocates to the nucleus in mammalian cells exposed to control (DMSO, top panel) or
dexamethasone (bottom panel) for 30 min. Nuclei are costained with DAPI. Scale bar, 5 μm. (b) Worklow for
image-based screening of environmental contaminants with glucocorticoid activity using the Perkin Elmer
OPERA image screening system. (c) GFP-GR translocates to the nucleus in a concentration-dependent manner
upon treatment with known concentrations of hydrocortisone, dexamethasone, or corticosterone. An algorithm
for cytoplasm and nuclear segmentation was used to determine the mean GFP-GR intensity in both compart-
ments, and translocation was quantiied as a ratio of these intensities. Each value was normalized to the control
sample. Error bars represent the mean value ± s.e.m., n = 6 (P < 0.05, asterisks).