Environmental Engineering Reference
In-Depth Information
(a)
(b)
Ti
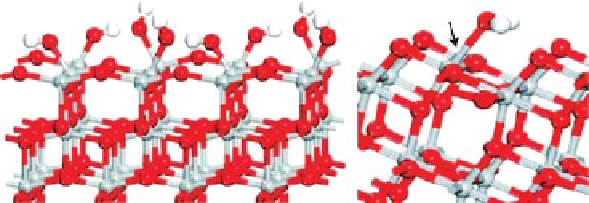
5c
FIGURE 11.16
Water adsorption behaviors on anatase (a) TiO
2
{001} vs. (b) {101} surfaces. (Adapted with permission from
Selloni, A.,
Nat. Mater.
, 7, 613. Copyright 2008, Nature Publishing Group.)
(a)
(b)
HN-BODIPY
highly fluorescent
UV light
DN-BODIPY
nonfluorescent
CH
3
OH
e
-
h
+
~0.5 µm
2 µm
~4 µm
~1 µm
Products
FIGURE 11.17
(a) Photocatalytic generation of luorescent HN-BODIPY from nonluorescent DN-BODIPY over a TiO
2
crystal.
(b) Transmission images of the same TiO
2
crystal immobilized on a cover glass in Ar-saturated methanol solu-
tion containing DN-BODIPY under a 488-nm laser and UV irradiation. The blue and red dots in the transmis-
sion image indicate the location of luorescence bursts on the {001} and {101} facets of the crystal, respectively,
observed during 3-min irradiation. (Adapted with permission from Tachikawa, T., Yamashita, S., Majima, T.,
J. Am. Chem. Soc.
, 133, 7197. Copyright 2011, American Chemical Society.)
(a)
(b)
(c)
(d)
E. coli
E. coli
200 nm
5 µm
500 nm
FIGURE 12.9
Fluorescent microscopic images of
E. coli
feed (a) and permeate (b). (c) SEM image of retained
E. coli
on the TNM
after iltration (low magniication) and a high-magniication SEM image (inset). (d) Cross-section SEM image of
TNM after iltration of
E. coli.
(From Zhang, H. et al.
J. Membrane Sci.,
343, 212, 2009. With permission.)