Environmental Engineering Reference
In-Depth Information
source and a charged coupled device as the detector in the range of 800-2000 cm
−1
at room
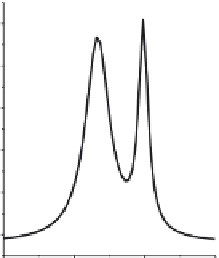
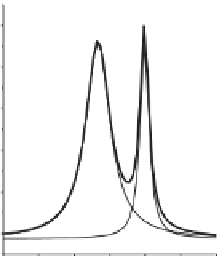
temperature in air. Figure 36.8 describes the Raman intensities of ACF, Ni-ACF, and CNF
grown on ACF. Table 36.3 presents the corresponding data extracted from the Raman graphs.
Typically, there are two peaks observed for carbon in the Raman spectra. The Raman
peak in the range of 1250-1450 cm
−1
corresponds to the D-band and is attributed to the
disordered components of carbon, whereas the peak in the range of 1550-1600 cm
−1
corre-
sponds to the G-band and is attributed to the ordered component (graphite). The
I
D
/
I
G
ratio
relects the extent of disorder in the carbons. In addition, the smaller the ratio, the more
highly ordered the graphitic structure. The
I
D
/
I
G
ratio of the ACF sample was determined
(a)
(b)
3000
360
2500
340
2000
320
1500
300
1000
280
500
260
800
1200
1600
2000
800
1200
1600
2000
Raman shift (Cm
-1
)
Raman shift (Cm
-1
)
(c)
800
700
600
500
400
300
200
800
1200
1600
2000
Raman shift (Cm
-1
)
FIGURE 36.8
Raman spectra of (a) ACF, (b) Ni-ACF, and (c) CNF grown on ACF. (From A. Gupta et al.,
I&EC Res
., 48, 9697,
20 09.)
TABLE 36.3
Laser Raman Spectra Parameters
Peak Shift (cm
−1
)
Area
S. No.
Sample
D-Band
G-Band
D-Band
G-Band
I
D
/
I
G
1
ACF
1331
1591
626,583
245,667
2.55
2
Ni-ACF
1333
1596
24,826
8833
2.81
3
CNF
1328
1591
117,779
40,635
2.89
Source:
A. Gupta et al.,
I&EC Res
., 48, 9697, 2009.