Environmental Engineering Reference
In-Depth Information
(a)
(b)
Mag = 100 KX
WD = 3 mm
Mag = 10 KX
WD = 3 mm
2 µm
200 nm
Signal A = In lens
EHT = 10.00 kV
Signal A = In lens
EHT = 10.00 kV
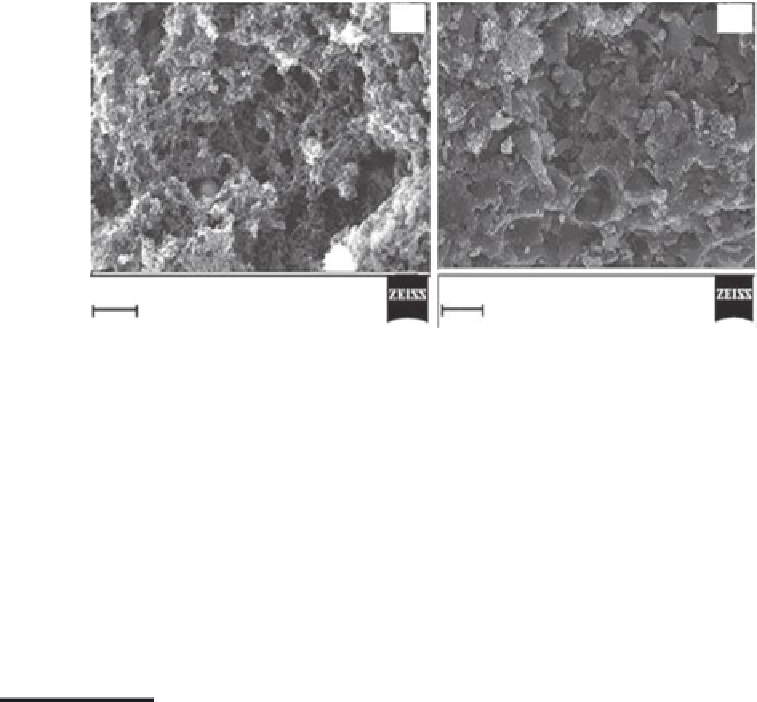
FIGURE 36.7
SEM images of activated Fe-doped carbon nanoparticles (a) before and (b) after As adsorption. (From A.K.
Sharma et al.,
Chem. Eng. Sci
., 65, 3591, 2010.)
activated specimen. Figure 36.6f is the representative EDX spectra after arsenic adsorption.
The EDX spectra conirmed the presence of Fe and As in the specimen.
The SEM image shown in Figure 36.7a corresponds to the specimen of the carbon
nanoparticles (~100 nm) produced after the milling of the phenolic spherical beads, fol-
lowed by carbonization and activation. The surface of the particles is rough and porous.
Figure 36.7b is an SEM image of the sample adsorbed with arsenic.
36.6 Surface Area and PSD
In general, adsorbents should have relatively large internal surface areas. The solutes
adsorb onto the surface by physisorption and/or chemisorption. The adsorbents with a
large surface area provide a large number of active sites to which the solute can adsorb.
Such materials also act as an eficient support to the metal catalysts required for certain
end applications. Furthermore, adsorbents should have the required PSD of micropores,
mesopores, and macropores, depending on the size of the target adsorbate molecules.
The total surface area of the above-discussed carbon-based nanoadsorbents was deter-
mined from the multipoint adsorption/desorption isotherms. The isotherms were mea-
sured from the pore volume of the adsorbents using nitrogen as the adsorbate molecule at
77 K. The well-known BET equation was applied in its linearized form in the region of the
relative saturation pressure range between 0.05 and 0.35 to calculate the speciic surface
area. The BET plot is usually linear in this range. Moreover, most of the micropores are
illed in this range. The total pore volume was measured from the amount of N
2
adsorbed
at the relative pressure close to unity (0.9994). The PSD was determined by the Barret-
Joyner-Halenda method.
The surface characteristics data from the ACF, the ACF containing Ni in its reduced state,
and ACF/CNF samples are reported in Table 36.1. The ACF substrate exhibited a very high
surface area, indicating high porosity. After impregnation with the metal salt, the sur-
face area decreased as the salt blocked some of the pores. Interestingly, the CNF samples