Environmental Engineering Reference
In-Depth Information
(o)
(q)
(m)
(l)
400 µm
100 µm
1 mm
300 µm
1.2
(n)
1.1
0 min
2 min
10 min
20 min
30 min
40 min
50 min
60 min
90 min
120 min
150 min
180 min
210 min
240 min
270 min
5
0.2 µm
0.9
0.7
0.5
0.3
0.1
-0.1
4
1.0
(r)
45
40
35
30
25
20
15
10
5
0
Residual R6G
Experimental
Pseudo-first-order
Pseudo-second-order
(p)
3
O
0.8
2
1
0.6
0
0 0 0
120
160
200
240
0.4
Time (min)
0.2
0.0
RS
Ch
Ch-RGO-
Ag@RS
Ch-RGO-
Mn@RS
Ch@RS
300
400
500
600
50 nm
Wavelength (nm)
5 nm
Adsorbents
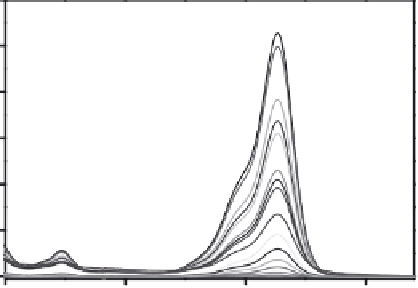
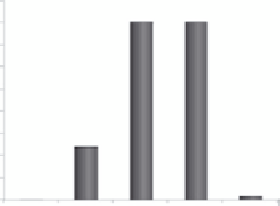
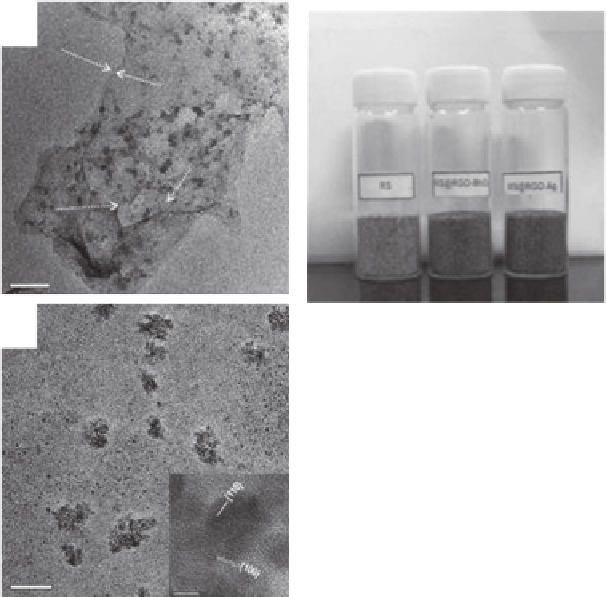
FIGURE 34.1 (Continued)
(l and m) SEM images of GSC. (n)
UV/visible data showing time-dependent removal of R6G. Inset: removal of R6G as function of time (primary axis). The pseudo-
second-order model its are shown in secondary axis. (Adapted from Sreeprasad, T.S. et al.,
J. Hazard. Mater.
,
246-247, 213, 2013. With permission.) (o and p) TEM
images of RGO-MnO
2
(0.05 mM). (q) Photograph of different graphene composites immobilized on sand. (r) Comparison of adsorption capacities of immobilized
composites. (Adapted from Sreeprasad, T.S. et al.,
J. Hazard. Mater.
186, 921, 2011. With permission.)