Environmental Engineering Reference
In-Depth Information
+37%
+20%
+68%
+81%
+29%
%
+10%
Projected
population
growth
To tal freshwater withdrawal, 1995/available precip.
percent, number of countries in parentheses
>=500
100 to 500
30 to 100
5 to 30
1 to 5
0 to 1
+36%
(49)
(207)
(303)
(740)
(1078)
(614)
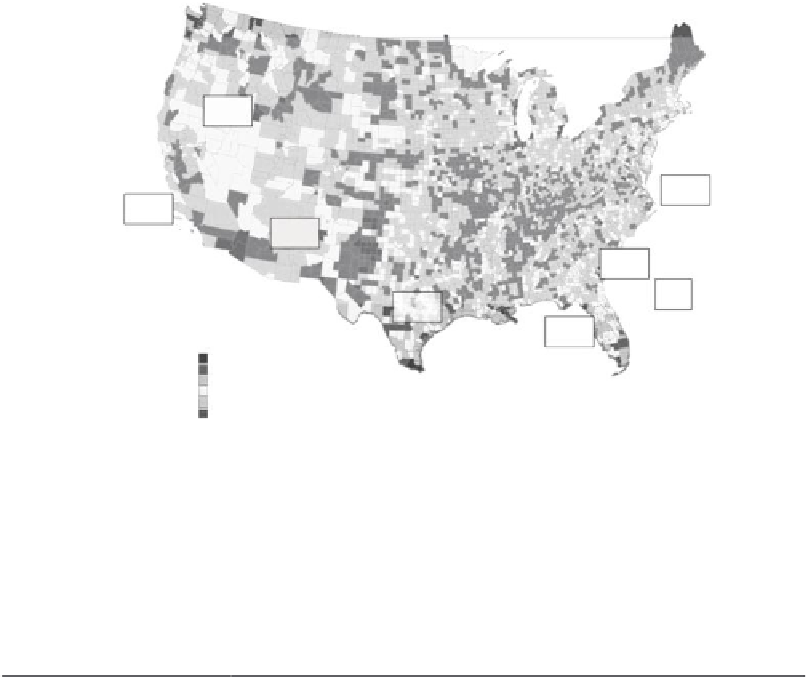
FIGURE 28.2
(See color insert.)
Projected population growth by percentage and water shortages by color. Water shortage is
deined as total freshwater withdrawal divided by an area's precipitation, based on most recent available data.
(From USDOE,
Energy Demands on Water Resources
. US Department of Energy, 2006.)
TABLE 28.1
Representative Description of Declining Groundwater Resources
Region
Groundwater Decline
Long Island, NY
Water table declined, stream lows reduced, saltwater moving inland
West central Florida
Groundwater and surface water declining, saltwater intruding, sink holes
Baton Rouge, LA
Groundwater declining up to 200 ft
Houston, TX
Groundwater declining up to 400 ft, land subsidence up to 10 ft
Arkansas
Sparta aquifer declared “critical”
High Plains
Declines up to 100 ft, water supply (saturated thickness) reduced over half
Chicago-Milwaukee area
Groundwater serving 8.2 million people has declined as much as 900 ft
Paciic Northwest
Declines up to 100 ft
Tucson/Phoenix, AZ
Declines 300-500 ft, subsidence up to 12.5 ft
Las Vegas, NV
Declines up to 300 ft, subsidence up to 6 ft
Antelope Valley, CA
Declines >300 ft, subsidence >6 ft
Source:
USDOE,
Energy Demands on Water Resources
. US Department of Energy, 2006; Vinson, D.S., H.G.
Schwartz, G.S. Dwyer, and A. Vengosh,
Hydrogeology Journal
, 19, 981, 2011.
Several examples of nanotechnology that provide opportunities and potential solutions to
the energy-water nexus challenges are discussed in each of the sections below. Figure 28.3
[7] shows a well-documented data plot presenting water withdrawals in the United States
based on use in a variety of applications. It is evident from Figure 28.3 and the estimates
provided by the USDOE and the US Department of the Interior that >40% of total water
withdrawals are for thermoelectric cooling for power generation [5,8-10]. The next largest
block of water withdrawal is for agricultural and livestock use at approximately 39% of all