Environmental Engineering Reference
In-Depth Information
(a)
400
300
200
100
0
0.0
0.2
0.4
0.6
0.8
1.0
Relative pressure (
P
/
P
0
)
(b)
0.7
0.6
0.5
0.4
0.3
0.2
0.1
0.0
050100 150200 250300 350400 450500 550600 650
Mean radius (Å)
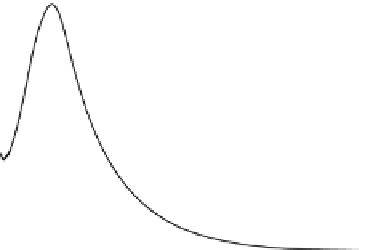
FIGURE 2.13
Nitrogen adsorption isotherm measurements of a porous carbon (HPC-f): (a) experimental data; (b) calculation
of the pore size distribution using the BJH method.
corresponding pore size distribution, calculated by the Barrett-Joyner-Halenda (BJH)
method. It should be borne in mind that the data are based on a model and not in the direct
observation of the porosity. There are techniques, such as small angle x-ray scattering, that
can directly measure the nanoporosity of ordered porous solids where the solid part has
high x-ray contrast (e.g., SiO
2
) [129].
2.3.2 Direct Measurement of Carbon Porosity
The porosity of carbon was measured directly using FE-SEM nanotomography. In this
technique, thin (10 nm) slices of the porous solids are sequentially removed using an FIB
of Ga ions and the exposed surface examined using FE-SEM (2-3 nm resolution). The sur-
face images are collated into a three-dimensional picture of the porous solid. Figure 2.14
shows a typical nanotomography image of a porous carbon. The macroporosity (>50 nm)
and some mesoporosity (>2 nm) are accessible to the technique; however, the microporos-
ity cannot be measured.