Environmental Engineering Reference
In-Depth Information
22.2.4.2 Centralized Monitoring and Control
With the increasing number of installations, some of which are in remote areas that are
hard to get to, WaterHealth realizes the signiicance of remote monitoring and control of
its WHCs. It has embarked on using the available state-of-the-art technologies to man-
age the scale of operation and quality of service. Plants are being retroitted or installed
with sensors and inline analyzers to enable real-time parametric monitoring of the process
and the water quality. Data collected are sent to a central server so that all plants can be
monitored centrally, and if any problem is detected, a service crew can be dispatched in a
timely manner. Taking advantage of the widespread cellular phone network in the coun-
tries WaterHealth operates in, data from WHCs are transmitted to the central server using
cell phone modems. It is expected that in the long run, these remote monitoring systems
will help WaterHealth to operate a global network of centers and keep the operational
c o st s low.
22.3 Need for Low-Cost Technologies
For its raw water needs, WaterHealth draws water from whatever source is conveniently
available locally. First installations of its WHCs concentrated in the coastal regions of
the state of Andhra Pradesh in India and in southern regions of Ghana around the capi-
tal city of Accra. At these locations, surface water was plentiful and these sources were
deemed to provide a perennial supply of water. It is well documented that with surface
water bodies, the primary contaminants present in the water are (i) suspended solids
affecting the clarity; (ii) organics such as tannins affecting the taste, odor, and color; and
(iii) microbiological organisms that create a health hazard. Elevated levels of dissolved
salts are generally not an issue for inland surface water sources. In the southern regions
of Ghana, because the soil is rich in manganese ores, surface waters do get contaminated
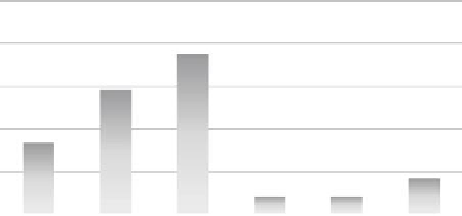
with elevated levels of iron and manganese (see Figures 22.7 and 22.8). It is interesting to
note that 83% of the sites have water exceeding the allowable limit of 0.3 mg/L for iron
and 16% of the sites exceed the WHO guideline of 0.4 mg/L for manganese. Levels of both
iron and manganese show a seasonal variation. During wet seasons, particularly after a
100%
50%
38%
80%
40%
29%
60%
30%
40%
20%
17%
8%
20%
10%
4%
4%
0%
0%
<0.3
0.3-1.0
1-5
5-10
10-15
15-20
Iron (mg/L)
FIGURE 22.7
Distribution of iron levels in surface water sites in southern regions of Ghana.