Environmental Engineering Reference
In-Depth Information
6000
Arsenic
5000
4000
3000
2000
1000
0
2000
2001 2002 2003 2004 2005 2006
Ye ar
2007 2008 2009 2010 2011 2012
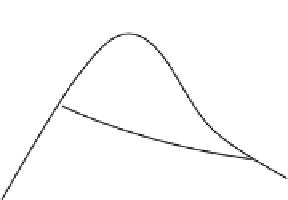
FIGURE 18.7
Trend of per capita GDP for Iran. (From World Bank. Available at http://data.worldbank.org/country/iran.)
Figure 18.7 shows how the economic boom can postpone the occurrence of the return-
ing point in the EKC. In this igure, the trend of per capita GDP for Iran and the level of
required GDP per capita for occurrence of the turning point for arsenic pollution (hori-
zontal dotted line) are illustrated. As can be seen in the plot, it can be concluded that the
time has not come for arsenic abatement for the case of Iran.
Consequently, it seems important to ind a way to leapfrog the EKC and to enable low-
income developing countries to avoid the need for a higher amount of per capita income
for the turning point.
18.3.1 Tunneling through EKC
The fact that the EKC can be reshaped in a way that the turning point occurs at lower levels
of pollution and GDP is termed “tunneling the EKC” (Culas, 2012; Munasinghe and Swart,
2004; Miah et al., 2011; Munasinghe, 1995, 1999; Rudel et al., 2005). As shown in Figure 18.8,
the concept proposes that these countries can learn from developed countries' experiences
to take alternative routes to leapfrog the EKC to inhibit environmental degradation dam-
ages from early stage and thus tunnel through the EKC.
Unsafe zone
Safe zone
Tunneling
Per capita income (development level)
FIGURE 18.8
Tunneling through the EKC. (From Culas R.J.,
Ecol. Econ.
, 79, 44, 2012.)