Environmental Engineering Reference
In-Depth Information
The green revolution did, however, positively alleviate India from starvation to becom-
ing a food surplus nation. It is the use of fertilizers and high-yield hybrid seeds that have
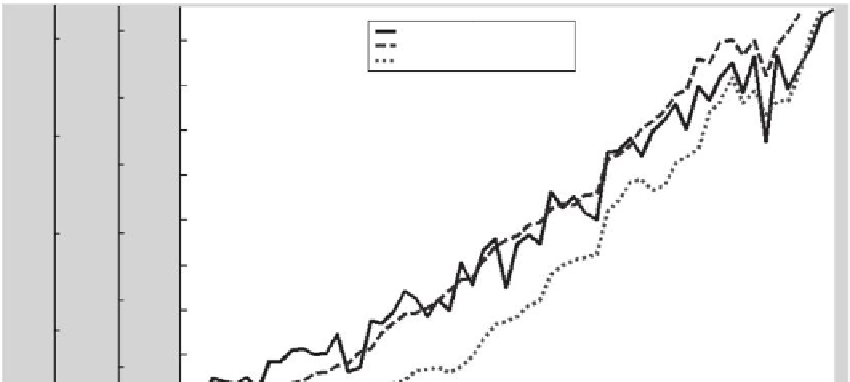
been the primary drivers for this turn around. Figure 15.9 is a graph that reveals the linkage
between increased fertilizer consumption and food production, for the period 1950-2000,
along with the increase in irrigated land. In other words, the increase in food production
could also be linked to the increase in irrigated land.
However, with a closer look at the trends at the onset of the green revolution (Figure 15.10),
it is evident that the increase in food production immediately followed the increase in irri-
gated land, while the increased adoption (and availability) of chemical fertilizer was yet to
take off. This clearly shows that the increase in food production is more closely linked to
the amount of irrigated land rather than the use of chemical fertilizer (Kailas et al. 2011).
Subsequently, owing to the forced dependence on extensive chemical fertilizer usage, the
practice of biofertilizers use declined, so much so that today modern progressive farmers
are not conversant with sustainable and natural biofertilizer use. It is also important to
note that because of a severe detrimental health impact attributed to crops grown under
heavy chemical fertilizer (and pesticide) use, worldwide there is an increased revival to go
back to traditional natural cycles that are sustainable and healthy.
One must acknowledge that increased irrigated land also dramatically accelerated the
fall in the groundwater table, which can be more attributed to the high-yielding crops
and waste rather than the effective use of water. This increase in water use for irrigation
also opened a cycle that was closed loop for millennia. All these factors led to a dip in the
80
Food grain production
Irrigated area under cultivation
Fertilizer consumption
200
220
200
70
180
150
60
160
140
50
100
120
40
100
50
80
30
60
0
20
40
2
1950
1990
2000
1960
1970
1980
Ye ar
FIGURE 15.9
Graph showing increase in food production with increase in chemical fertilizer use, and the amount of irri-
gated land. (Data from RBI,
Handbook of Statistics of the Indian Economy 2008-09
. Reserve Bank of India, Alco
Corporation [for RBI], Mumbai, pp. 50-85, 2009.)