Information Technology Reference
In-Depth Information
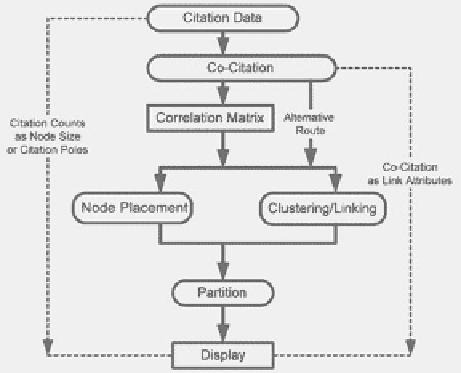
Fig. 5.10
A generic
procedure of co-citation
analysis.
Dashed lines
indicate visualization options
to work on correlation matrices. To our knowledge, there is no direct comparison
between the two routes in terms of the quality of clustering, although it would be
useful to know the strengths and weaknesses of each route. Partition can divide a
global view into more manageable regions and make the map easier to understand.
Finally, additional information such as citation counts and co-citation strengths can
be rendered in the map to convey the message clearly.
In their pioneering 1981 study, White and Griffith created the first ever author
co-citation map of information science from the Social Sciences Citation Index
®
(SSCI) for 1972-1979. Their map showed five main clusters of author within
the field of information science (See Fig.
5.11
). Each cluster corresponded to a
specialty:
1. Scientific communication,
2. Bibliometrics,
3. Generalists,
4. Document Analysis/Retrieval evaluation/Systems, and
5. Precursors.
In this first author co-citation map of information science, scientific communica-
tion is on the left and information retrieval on the right. Over the last 20 years,
researchers have created several co-citation maps of the field of information
science - their home discipline. Later maps have shared some characteristics of
this structure.
The author co-citation map produced by White and Griffith (
1981
) depicted
information science over a 5-year span (1972-1979). In 1998, 17 years later,
White and McCain (
1998
) generated a new map of information science based on
a considerably expanded 23-year span (1972-1995). They first selected authors
who had been highly cited in 12 key journals of information science. Co-citations
of 120 selected authors between 1972 and 1995 were extracted from SSCI. They

Search WWH ::

Custom Search