Information Technology Reference
In-Depth Information
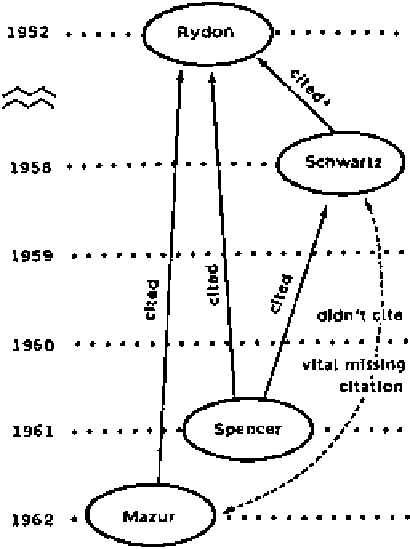
Fig. 5.5
Citation analysis
detected a vital missing
citation from Mazur's paper
in 1962 to Rydon's paper
in 1952
Recently, science-mapping techniques have begun to reveal structures of
scientific fields in several promising visualization metaphors, including networks,
landscapes, and galaxies. The ability to trace scientific and technological
breakthroughs from these science maps is particularly important. The key questions
are:
what are these maps telling us, and how do we make use of such maps at both
strategic and tactical levels?
Today's most widely used citation index databases such as SCI and SSCI were
conceived in the 1950s, especially in Garfield's pioneering paper published in
Science
(Garfield
1955
). In the 1960s, several pioneering science mapping studies
began to emerge. For example, Garfield, Sher, and Torpie created the historical map
of research in DNA (Garfield et al.
1964
). Sher and Garfield demonstrated the power
of citation analysis in their study of Nobel Prize winners' citation profiles (Sher
and Garfield
1966
). Figure
5.5
shows how citation analysis spotted a vital missing
citation to earlier work (Garfield
1996
).
In the 1970s, information scientists began to focus on ways that can reveal
patterns and trends reflected through scientific literature. Henry Small demonstrated
the power of SCI-Map in mapping the structure of research in AIDS (Small
1994
).
Once the user specified an author, a paper, or a key word as the seed, SCI-Map
could create a map of related papers by adding strongly co-cited papers to the map.
The creation of a map involved a series of iterations of clustering. The layout was
Search WWH ::

Custom Search